The second quarter of 2016 is now more than half over, but we won’t receive the first reading on 2016:Q2 GDP from the BEA until the end of July. A forecast of something that is happening right now is sometimes described as a “nowcast”. The Federal Reserve Banks of New York and Atlanta are providing a valuable service by publishing continuously updated nowcasts of GDP. But what should we do if they’re giving us rather different numbers?
Right now the Atlanta Fed’s nowcast is calling for second-quarter real GDP growth of 2.5% at an annual rate while the New York Fed says 1.7%. That’s actually a smaller disagreement than the two models began with on April 29, when the advance estimate of first-quarter GDP was first released. At that date the Atlanta model was anticipating 1.8% second-quarter growth while the New York model was only predicting 0.8%.
The forecast the two approaches start the quarter with is one of the key differences between the two models. The Atlanta model begins with separate forecasts of 13 individual components of GDP, such as personal consumption expenditures on goods, PCE on services, and investment in equipment. The start-of-quarter forecast is based on a regression of each component on 5 quarters’ lags of all the components, with the regression coefficients heavily weighted toward a random walk using a Bayesian prior, according to which the best forecast of next quarter’s equipment investment is probably not too far from whatever the number was for this quarter. By contrast, the New York model begins with a “top-down” approach, starting with a forecast of overall economic activity based on the best current assessment of overall activity.
From that starting point, both models then process every major new piece of data as it comes in. Based on the historical correlation between each new measure and any variables of interest both models generate a continuously updated assessment of everything that might matter for the current values of all the variables that we observe. For example, the New York Fed GDP nowcast was lifted up by the solid reports on retail sales and industrial production and capacity utilization for April.
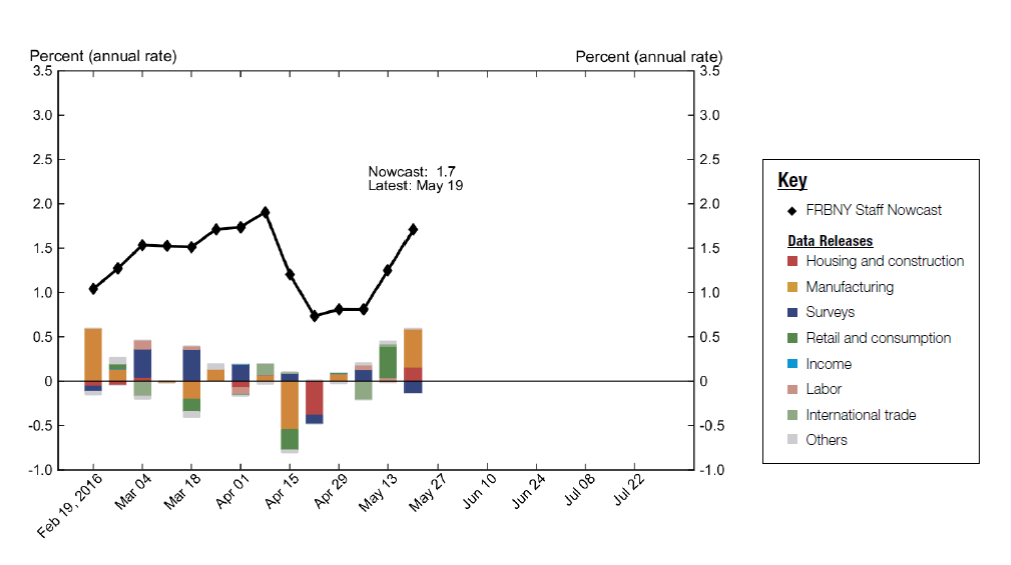
Evolution of Federal Reserve Bank of New York nowcast of 2016:Q2 real GDP growth rate (in black) along with contributions of specific news releases to the change (in color). Source: Federal Reserve Bank of New York.
The retail sales report was also the biggest single factor that lifted up the Atlanta nowcast.
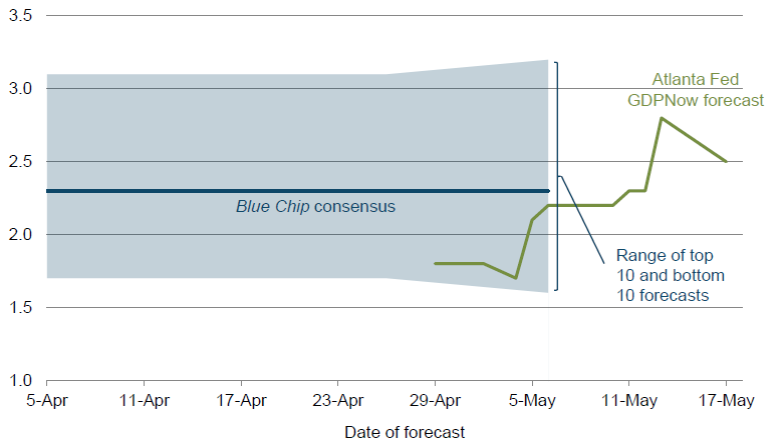
Evolution of Federal Reserve Bank of Atlanta nowcast of 2016:Q2 real GDP growth rate (in green). Source: Federal Reserve Bank of Atlanta.
A lot of economic research suggests that one of the best ways to reconcile conflicting forecasts is simply to go with their average, which in this case would be 2.1%. For that matter we might want to also throw in the pre-quarter Blue Chip consensus forecast (2.3%), Wall Street Journal survey of economic forecasts (2.2%), or the Survey of Professional Forecasters (2.1%), which all give us pretty much the same number as the average of the two Fed nowcasts.
In any case, the record of the large-data processing algorithms like those of either the New York or Atlanta Fed is that by the middle of July (a few weeks before the advance release of the Q2 GDP numbers) we should have a pretty good idea of what the BEA is going to tell us.
Blue: WSJ survey estimates 12 days before the advance GDP numbers were released. Red: Federal Reserve Bank of Atlanta nowcast as of the 12th day of the month in which the advance GDP numbers were released. Grey: advance GDP numbers for that quarter. Source: Macroblog.
We are now nearly 7 years into the worst recovery since WWII and yet nobody thinks that reducing the deficit 75% over that period was a bad idea.
During the Reagan recovery from 1983 through 1988, real GDP growth was twice as much and not one year was as low as Obama’s best year for growth. Of course Reagan tripled the federal debt and ran record deficits throughout his recovery, but apparently nobody can see any connection there.
Under Reagan, there were huge middle class tax cuts, deregulation, few new regulations, and spending cuts, except military spending, which eventually won the Cold War, that spurred a strong recovery.
Under Obama, there were small and slow tax cuts, lots more regulations on top of excessive regulations, and spending increases, except military spending, which doesn’t even contain our enemies, that slowed the recovery.
I think in a sense we need to provide a viable alternative market/finance mechanism to the current one. Otherwise we always fall into the cycle that traders wreak havoc — regulations — GOP attack the government
peak, under reagan you had significant deficit spending and government employment growth. those were the major policies which contributed to your view of the reagan oasis. under obama, you had a republican congress who was more interested in sabotaging obama and his legacy than they were with actually implementing solutions to the nations problems. the republican led government shutdown was a prime example of republican malpractice.
Obviously, not all deficit spending is the same. Reagan’s policies on taxes and regulations weren’t major policies to you?
You remain in denial about key facts, like Obama’s 60-vote Senate and House his first two years that set the major economic policies, along with substantial power thereafter.
“Reagan’s policies on taxes and regulations weren’t major policies to you?”
yes, as were the policies he chose to follow regarding deficits and the debt. tax cuts which produced increased deficits and debt are his legacy.
“You remain in denial about key facts, like Obama’s 60-vote Senate and House his first two years that set the major economic policies”
obama provided stimulus in those first two years, smaller than what was needed but provided nevertheless. once the republicans controlled congress, they systematically derailed any possibility of fiscal stimulus and implemented federal government contraction during a recovery. those were foolish policies which obama did not promote. but he also could not stop the train wreck. you think the government shutdown was not detrimental? don’t blame obama for a slow recovery when half of the congress was intent on stalling the economy for political gain.
I really sometimes can’t tell if you are a real person, or a robot designed to say nothing factual.
Under Reagan, there were not huge middle class tax cuts. The payroll tax rate increased from 12.26% in 1980 to 15.02% in 1988. And, as I’m sure you know, the payroll tax hits middle class people much harder than income taxes. The income tax cuts early in his presidency were almost exclusively favored towards the rich. The tax cut in 1981 eliminated all of the brackets above $144,000 per year ($380,000 today, or the top 1%) and lowered the top rate from 70% to 50%. Note that about 1/3rd of the revenue lost was later made up with tax increases because the deficit was growing too much.
Deregulation did occur under Reagan, but not to the extent that people like you think. There was a huge wave of deregulation in the 70s in the auto, truck, and plane industry. Reagan did deregulate the banking sector in the Depository Institutions Act, which many say was the root cause of the savings & loan crisis (which taxpayers bailed out for about $140 billion, or about $250 billion in today’s $).
And, like most people, you conveniently leave out the Federal Reserve stimulus that was able to occur in the early 80s that had a much bigger effect on capital investment than reduced taxes. You also ignore the fact that government jobs grew by about 1.4 million during the Reagan years, while government jobs are on pace to decrease by about 600,000 through the end of Obama’s years.
Regarding Obama’s legacy, there were fairly large tax cuts for the middle class in the stimulus and, more importantly, the payroll tax holiday. There were new regulations added, but not at a much faster rate than the previous two administrations, and many of those regulations were focused on the financial sector which clearly needed more policing.
You exhibit a comical amount of bias and disingenuity in your comments. You really should step back and look at some more object economic history.
Mike V, Reagan cut taxes substantially across the board to spur growth. Taxes were later raised to slow the strong expansion and increase tax revenue, which is sound economics.
There weren’t massive anti-growth regulations under Reagan. However, more regulations when a sustainable expansion is underway makes economic sense.
Maintaining price stability in the1980s was more restrictive monetary policy than the inflationary growth in the 1970s.
In a strong economy, government can grow with the economy. In a weak economy, government can shrink with the economy. i hope I cleared up some of your nonsense, although much more work is needed.
“Taxes were later raised to slow the strong expansion and increase tax revenue, which is sound economics.”
they were raised only after realizing the tax cuts could not pay for themselves.
“In a weak economy, government can shrink with the economy.”
we have several episodes to now dismiss this austerity nonsense.
You respond to facts and data with no facts or data. Just hand waiving and disingenuous talking points or simple nonsense (I have no idea what you’re trying to say about monetary policy – it makes no sense).
“In a strong economy, government can grow with the economy. In a weak economy, government can shrink with the economy.” This is exactly the opposite of what should happen! You are incoherent and contradictory. Simply laughable.
Reagan gave a “can do” optimism.
Obama gave a “can get” optimism.
considering the growth of the government deficit and debt under the reagan years, you should consider that era the “can get” as well.
Winning the Cold War wasn’t cheap. And, rather than focus on taking a bigger slice of someone else’s pie, individuals should focus on creating bigger pie’s for themselves, i.e. exchanging output for income, which actually creates value for society.
” individuals should focus on creating bigger pie’s for themselves”
stagnant wages in light of increasing corporate profits makes this a very difficult proposition for an individual. one of the reasons unions existed and middle class prospered years ago.
You’ve made this exact comment before failed to mention interest rates that time also. You give presidents way too much credit for big macro trends. And for the record, this recovery better than the recovery in every other advanced country and better than recoveries from other severe financial shocks.
This has been a very unique “recovery.”
Monetary, fiscal, and other economic policies out of Washington not only created a very expensive depression, it put us in a weak position to deal with the next downturn.
Of course, other economies suffer from the weak U.S. “recovery,” after the severe recession. Fortunately, the country is much wealthier and more diversified than during the Great Depression.
It would’ve been even worse without older people working longer and harder, the domestic oil boom, and smaller trade deficits, to boost GDP. Unfortunately, one foot is still on the accelerator, while the other foot remains firmly on the brake.
Mike v: For six long years, the Fed engineered a flood of liquidity unprecedented since the time of the Wiemar Republic. In the process, it blew the third largest stock market bubble in history. An oil price bubble. And a housing bubble now 37% of the way to its 2006 peak. In the process, a score of unintended consequences were propagated including the oil price bubble, never-before-seen negative interest rates in Europe and Japan, historic global debt, a virtually insolvent banking system in China which is now diverting attention away from direly needed strategic reform, and a carry trade that’s reversing and playing havoc with emerging market growth and has the globe at the very brink of currency wars. The piper is yet to be paid. It will be. When it is, a goodly part of the US growth you tout will be seen to have been faux . It is understandable that you and others do not see this. Unintended consequences, negative nominal interest rates, carry trade reversal, excessive debt and the need to deleverage from it, and faux growth are nowhere to be found in the textbooks.
Thanks to the Fed attempting to maintain price stability to optimize growth, lower interest rates and higher asset prices induced people to spend and borrow, and reduced saving, a lower cost of capital spurred production, refinancing at lower rates increased discretionary income, lower mortgage rates made buying a home more affordable, 401(k)s and IRAs increasd in value, etc. There were massive multiplier effects throughout the economy.
The Fed did its job. Unfortunately, it didn’t get much help from Washington politicians, who created both massive anti-growth and massive pro-growth policies resulting in a very expensive and very slow recovery.
Sorry, but GDP is heavily based on prime working age population growth to age. The worst recovery, it isn’t. I would say it is around the 90’s in style. It is basically the fact retirees are outstripping newbies. When that ends, the factory methods of GDP will raise estimates by the 2020’s.
That is why the U-6 has dropped below 10% and I suspect by next year, it will be below 9%.
Demographics doesn’t explain the sudden and sustained downshift in growth, since 2009.
The 2007-09 recession wasn’t the deepest, but the recovery continues to be the weakest.
Actually, yes it does. The factory method of GDP accounting is the key. When retirees outstrip new entrants, trend growth falls. It is pure and simple as that. My guess by this October, your nostrils are going to be flaring and the pain of what you see will make you rethink of everything you know about economics. Considering I know of whole departments literally overhauled the last 5 years(really started hearing it in some sectors in the 2000’s) due to retirements, it is pretty big.
You guessed wrong. The labor force peaked around 2000 and the path has been a slow decline. Other factors have caused the decline to accelerate.
Professor Hamilton,
How do US interest rates return to more “normal” ranges when US and World GDP are under or near 2.0% and inflation and interest rates are negative in Europe? Are we going to experience low rates for the next five to ten years? It is beginning to seem that there is no end to low rates. I would like to be a reverse indicator on the low interest rate lament.
AS: The relation between GDP growth rates and interest rates is much weaker than popular discussion might have you believe. For example, for the 10 years ending in 1983, the average real GDP growth rate was 2.2% and the average real interest rate was 5.4%. By contrast, for the 10 years ending in 2003, the average real GDP growth rate was 3.3% and the average real interest rate was -1.2%. See this paper for discussion.
Thanks. Do I read the paper correctly that we may see the Federal Funds Rate at 3+% by 2017. As mentioned, it is starting to seem that rates will never get to the “lofty” levels of 3+% again. Such feelings often seem to be a sign of a reverse indicator.
i’ve long had some disagreements with some of the ways the Atlanta Fed comes up with their GDPNow estimates during the month…to start with, they incorporate the monthly results of the ISM surveys, unweighted diffusion indexes derived from samplings of subjective executive opinion….any correspondence those survey results have with the output of goods and services for the same month is pure chance…in addition, they always update their estimate of GDP on the day of the retail sales release, which tells us nothing about real personal consumption and hence output until we get the release of consumer price index several days later…moreover, they not only ignore the results of the CPI, they also don’t incorporate any results from the PPI-FD release or the import-export price index into their estimates…components of the PPI are used to adjust construction, inventories, and other investment for changes in price to give us the real change in output…some months, change in prices is one of the largest factors in the change in GDP…for example, nominal inventories might be reported down 0.5%, but if corresponding producer prices for the same period were down 1.0%, that means real inventories were up 0.5%…someone at the Atlanta Fed need to sit down with the NIPA handbook and see how GDP is really computed…
That is one way of looking at it.
But another way is that the 10 years ending in 1983 saw three recessions, each brought on by tight money. In contrast the next recession after 1983 was not until 1990 and it was a very minor recession.
Moreover, in the ten years after 1983 interest rates has what is probably the largest decline in recorded history while the 10 years leading up to 1983 saw what probably was the largest rate increase in history. Maybe you should look at the change in rates, not the level.
Comparing growth over complete cycles and having the end data point in a major recession to growth starting at the bottom of a very severe recession seems to be a bit of cherry picking the data.
You may be right that interest rates may not be all that powerful, but you example is not that persuasive.
Spencer: I think that AS was asking how could interest rates rise if long-run growth is now 2% instead of the historical 3%. I understood him to be asking about the long-run effect of growth on interest rates, not the short-run effect of interest rates on growth.
Yes, Professor Hamilton, that which you describe is what I was asking.
I was also asking how interest rates in the US could rise materially given negative rates in the Eurozone and how US rates could rise materially given negative inflation in the Eurozone. As I understand (perhaps not clearly) from your article, is that (generally) the only somewhat stable (cointegrating) relationship is the difference between US and world rates, which seems to say that US rates cannot now increase much currently. After reading your article, I imagine (perhaps incorrectly) that world interest rates can be pictured as a school of fish, with each country one of the fish and periodically there is a shock and the school of fish changes direction. Seems tough to forecast.
AS: Interest rates have always been difficult to forecast. You have to get both the funds rate and the 2-10 spread right. These are entirely different animals. GDP was and still is far easier to forecast accurately. Even the peak and trough of the cycle is easy if you study carefully enough and develop a methodology that works. However, since the crisis forecasting rates has become a magnitude more difficult. This is a different world. ZIRP and debt-to-GDP are the new constraining variables that must be taken into account. Also, global factors have far more effect today, and the financial sector is far more disconnected from the real sector. The latter, by the way, is a great travesty that afflicts the American people.
I’ll leave you with a thought. Events analysis has always been the key to consistently good rate forecasts. I am speaking about understanding the day to day movement of markets. Time series of quarterly observations are virtually useless for real time analysis (though they do help deepen broad understanding of how rates work). Case in point. Last week the Fed signaled that June is front and center for another funds rate hike. From my near-zero expectation of a June hike ever since the hike in December – a probability to which the market had begrudging come around to as well – just last week I moved 180 degrees to now expecting one. We shall see. After the June hike, if it does indeed come off, the next move in funds will then likely be down! Much is coming down the pike to stifle growth later in the year. To make such a projection requires evidence of a far broader, more complex nature than day-to-day events. Critically including what is going on in China and with Europe’s big banks.
Over the next 90 days or so, watch the daily movement of the funds rate (via the futures), the 2-year, and the 10-year. It will be a real education, and you may want to come back and report on it.
Obama was no Reagan. How can someone compare them. But Obama was good in rhetorics, that’s why he was chosen by the 0.1% to tell us the nice things. H Clinton is not good in rhetorics, but good in lying that’s why she was chosen by the 0.1% to tell us the nice things at least before election date.
https://www.youtube.com/watch?v=-dY77j6uBHI
And BTW, rate hike is in July. McBride is right about that again.
And I say before year-end we’ll see another one, you know it’s an election year with lot’s of good GDP data.
Hi James,
this is not forecast, this is a European Union stress test for insurers launched yesterday.
But what a test of “secular stagnation” !
https://eiopa.europa.eu/Publications/Surveys/EIOPA-BoS-16-109%20Insurance%20ST2016%20Technical%20Specifications.pdf
——————————————
3. Stress test framework
3.1 Low for Long (LY)
This scenario assesses the impact of a long-lasting low yield scenario with low rates for all maturities.
It is based on a situation of secular stagnation. Savers facing a lack of long term investment opportunities and permanently low productivity growth – combined with a scarcity of risk free assets – drive down yields at all maturities.
(…)
assuming an extreme scenario of no-growth in the next 60 years for the EA [EA = Euro Area], the ultimate forward rate (UFR) set at 2.0% according to the inflation target set by ECB;
—————
Best regards,
Michel