The 2016Q1 advance release, discussed at length by Jim, provides additional evidence in favor extreme caution in tightening monetary policy — maybe even a reconsideration of the June rate hike that seems, according to conventional wisdom, a done deal.
First, the output gap increased slightly in 2016Q1. Even taking into account the uncertainty surrounding this sure-to-be revised estimate of first quarter growth, it doesn’t appear like the output gap (as implied by CBO’s estimate of potential) is still shrinking.
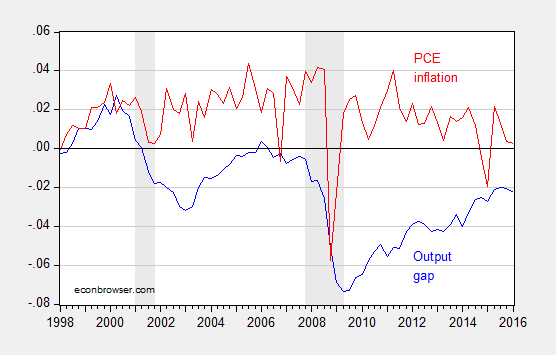
Figure 1: Output gap (blue) and q/q annualized PCE inflation (red), both calculated in log terms. NBER defined recession dates shaded gray. Source: BEA, CBO (January 2016), NBER, and author’s calculations.
Second, the interest sensitive components of aggregate demand — nonresidential investment and net exports — are exerting drag on growth, in accounting terms.
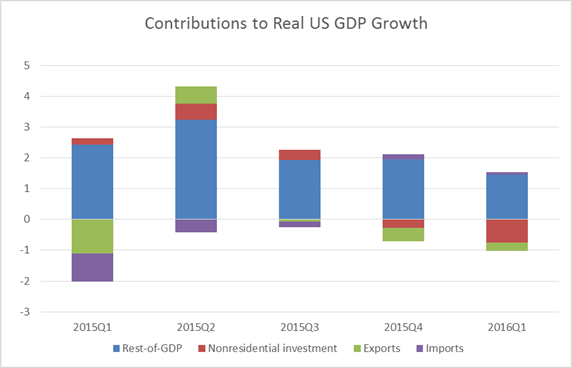
Figure 2: Contributions to real US GDP growth in percentage points, q/q SAAR, from nonresidential investment (red), exports (green), imports (purple), and rest of GDP (blue). Source: BEA, and author’s calculations.
While one might argue that investment is down because of the collapse in investment associated with the energy sector noted by Jim, what’s true is nonresidential investment excluding mining and well drilling is also down.
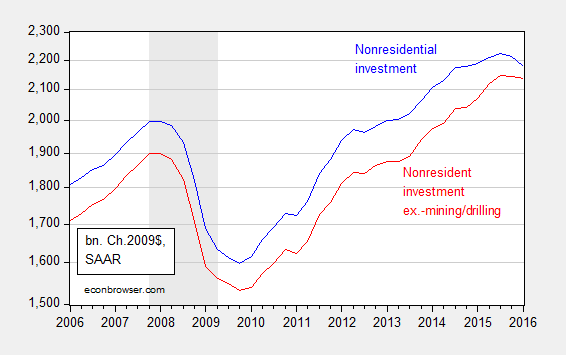
Figure 3: Nonresidential fixed investment (blue), and ex.-investment in structures, mining exploration, well shafts, and drilling (red), in billions of Ch.2009$, SAAR. NBER defined recession dates shaded gray. Log scale. Source: BEA and author’s calculations.
Third, net exports are likely to continue to stagnate, given the appreciation of the dollar that has already occurred.
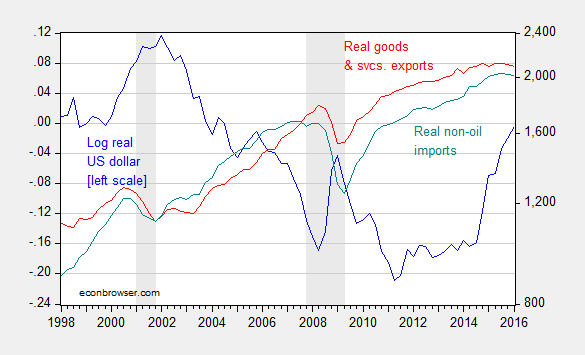
Figure 3: Log real value of the US dollar (against a broad basket) (blue, left scale), and exports of goods and services (red, right log scale), and imports of non-oil goods (teal, right log scale), both in billions of Ch.2009$, SAAR. NBER defined recession dates shaded gray. Source: Federal Reserve Board, BEA, and NBER.
Note that while US exports could decline because of either the surging dollar or the slowing world economy, the decline in US imports is striking. A stronger dollar (driven by interest differentials) implies a higher level of imports, so the decrease in imports is suggestive of a slowing US economy. Of course, there are only two months of trade data incorporated into the advance release, so it may be the March data (coming later this week) will erase this decline in imports.
My estimates using an error correction model involving exports, world GDP, and the real dollar and two lags of first differences over the 1973Q1-2016Q1 indicate a short run price elasticity of about 0.10, and a long run of 1.3. (See this post for a description of the methodology.) The half life of a deviation from long run (statistical) equilibrium in the export relation was about 2 years. That means that we have yet to see all of the depressing effects of the dollar appreciation that starts in 2014Q4.
A Fed tightening in June will likely further appreciate the dollar, thereby exacerbating the external drag on the US economy.
The market is already pricing in less than a 15% chance of a June rate hike. Isn’t that the conventional wisdom?
Yep, the fed funds futures market is, as of now, pricing in 8% odds of a June Fed hike. Lockhart, a bit of a hawk, was on the wire today saying that the Fed won’t have much information about Q2 GDP as of the June meeting (which is odd, given the accuracy of his own Bank’s GDPNow tracking estimates), but he doesn’t think June should be off the table.
June is still very iffy. Look for Fed officials to work harder than they have been to change market perceptions as a sign that a June hike is likely. Otherwise, the safer assumption is that they are not all that troubled by the market pricing in low odds of a hike.
I get your point, Dr. Chinn, because there is still some slack in demand that has to be restored. But there’s also gotta be a time when savings is encouraged, and entering the Wall Street bubble game is discouraged. Combine that with a Spring and Summer runup in gas prices leaving inflation over 2%, and don’t you at least have to raise it to a little more than 0.25%?
Then again, the savings rate went up to 5.2% in Q1, and auto and auto parts consumption went down, so maybe that’s the other side of the coin against a rate rise.
Jake formerly of the LP: If monetary policy is tightened at too early a time, inducing a recession, then aggregate saving might actually decline; remember the fallacy of composition and savings behavior.
My view: the best way to target bubbles in asset prices is not through monetary policies, but rather macroprudential policies. Higher capital requirements for instance reduce the return on equity, which is exactly what we want to do.
jake,
“But there’s also gotta be a time when savings is encouraged, and entering the Wall Street bubble game is discouraged.”
actually savings is being encouraged today, if you look at the cash status of companies and people. company profits are very high, as are cash holdings. many people are continuing to decrease leverage, which is occurring by taking their savings and paying down debts. what you are really demanding is the opportunity to make money on undeployed capital. interest rates are not artificially low, they are low because there is a perceived lack of strong growth in the future. i am not sure how higher interest rates would improve the prospect for higher future growth? with higher interest rates, would we not be paying artificially high prices for capital today?
Dr. Chinn, Baffling- I guess I’m looking at it from the consumer side more than the business side. From the business side, you can raise taxes,, force wage increases, and lower loopholes to discourage profit-hoarding that way. Sure, they may not be willing to borrow more with higher rates, but maybe it’s not exactly a sane economy to be based so much on borrowing and leverage.
I’m more concerned about having to have the public rely on gambling on Wall Street and other asset speculation, which is encouraged the longer rates stay low. And the 10-year rate and other interests are still staying low, so it’s not like government borrowing costs are going to go through the roof.
US debt up $1 trillion in last six months.
http://cnsnews.com/news/article/terence-p-jeffrey/6-months-budget-deal-debt-more-1-trillion
This is why we need an FAA.
Steven Kopits: I have a suspicion that CNS is reporting debt subject to limit (especially since the April Monthly Treasury report which reports aggregate debt is not yet online), which is not economically that interesting.
Also, there is seasonality in debt/gdp, so a half-yearly comparison is odd.
Yeesh. CNS probably belongs in the same bin as Shadowstats when reporting economic statistics, if this is anything to go by.
The debt limit was raised on Nov. 2.
Since Nov. 2 –
Debt held by the public is up a little less than $600 bn
Intra-governmental is up a bit over $100 million
Total government debt is up just under $700 million
However, since Oct. 30, just before the limit deal –
Debt held by the public is up $770 bn
Intra-governmental debt is up a bit over $246 million
Total government debt is up just under $1.017 trillion
CNS is correct that borrowing is up dramatically. Less clear are the reasons for this surge.
http://www.treasurydirect.gov/govt/reports/pd/debttothepenny.htm
Steven Kopits: My first point, is extraordinary measures taken before the resolution of the debt ceiling crisis, as described in paragraph 2 here, held down measured total debt. When those measures were unwound, then measured debt rose quickly.
Now the spike in 2016Q1 is not explained by that phenomenon. However, Q1 debt often spikes due to timing of tax payments, etc. Note that if one run a regression of debt-to-gdp on quarterly dummies, then one finds Q1 coefficient is usually the most positive.
So, to reiterate, I find it odd to report a half-yearly stat, making it seem like there’s an agenda to the article.
There was no new borrowing from March to November of 2015. Thus, the increase noted by CNS is correct, but the time frame is not on the uses of cash side. The deficit period covered is materially March 1, 2015 to April 1, 2016, that is, 13 months; the Treasury borrowed $1 trillion to cover 13 months of deficits over a six month period.
Having said that, $1 trillion of borrowing in total, $770 billion of public debt, is still a lot of money over the full period. Now the average of the FY 15/16 deficit is on the order of $500 bn. I am guessing that some of the borrowing was conducted in anticipation of an increase in rates, ie, more borrowed early, in which case we would expect to see indebtedness decline, and in fact we do.
Still, it’s a phenomenal amount of borrowing, and at $534 bn (CBO) for FY 2016, the deficit is much, much too large for this part of the cycle. We are deficit junkies, as I have said before, and there is a non-market failure around government borrowing. Egalitarians want more social spending, fiscal conservatives want lower taxes. But no one cares about debt, hence a large and chronic deficit with no real political will to reduce it.
I stand by what I said. If we had a fiscal accountability act, that deficit would be whittled down in no time.
You guys can nitpick who is to blame and how to measure it, but the total debt is up about $15 trillion under the last two Presidents. We need to act one way or the other.
Yes, and the solution is an FAA.
So when will it ever be time to raise rates? And what if we never hit those metrics again? If the economy isn’t strong enough when we have 5% “unemployment,” it will never be strong enough.
Hint: we will never materially raise rates ever again.
As I have said before (and will probably have to say a million times more), despite the obvious intellectual advancements made in more progressive sciences, economists continue to utilize what we might call a Newtonian Framework that they build their economic models upon. This framework is one in which it is assumed that our economy is much like a giant machine that can be analyzed, understood and modeled. That there are specific forces at work in our economy, and that human beings respond to these forces in much the same way that Newton proposed that planets and stars reacted to the physical forces in our universe.
Just as this type of framework misled Newton into thinking of the universe in terms of absolute space and time, economists continue to be misled into thinking of our economy in terms of economic absolutes (ex: saving is always good for the economy, lower interest rates will stimulate demand). The reality is that we live in a Relativistic world that can only be understood by looking at the relationships that exist in our world.
Because economists do not understand this, it is not at all surprising to routinely here idiotic comments coming out of the Fed. One of the more recent examples is the internal debate going on in the Fed over when they should begin financial “tightening” in order to keep the economy from overheating. If economists understood that interest rates are all relative, then they would understand that the Fed has actually been “tightening” for years.
Let us assume that the Fed Funds Rate is currently set at 2%. Would you consider this rate to be “loose” or “tight” (financially speaking)? The only way to answer that question would be to look at where market interst rates stand.
If current market rates were near 10%, then we would describe the Fed Funds Rate as being “loose” or “accommodative”. If, however, market rates were near 3%, then we would describe the same Fed Funds Rate as “tight”.
Since the Fed implemented its Fed Funds Rate of 0% back in 2009, market rates have essentially been cut in half. Thus by keeping the Fed Funds Rate constant in a period of declining rates, the Fed was effectively “tightening” the entire time. I guess it shouldn’t be surprising that the Fed doesn’t understand this. After all, they did led us straight into one of the worst financial disasters in history.
#EconomistsAreMorons