Paul Krugman recently characterized the current pace of trade activity as worse than that during the Great Depression. And indeed, Barry Eichengreen and Kevin O’Rourke have been diligent in illustrating how this is the case, most recently in this September VoxEU post. Caroline Freund ([pdf] here) as well as the IMF in its most recent World Economic Outlook (Box 1.1) attribute the sharp drop-off in world trade to high income elasticities, in part associated with the high degree of vertical integration that characterizes the globalized world economy. Below, I want to examine that explanation from the perspective of the US data. This follows up on several of my recent posts on the subject. [0] [1] [2] [3]
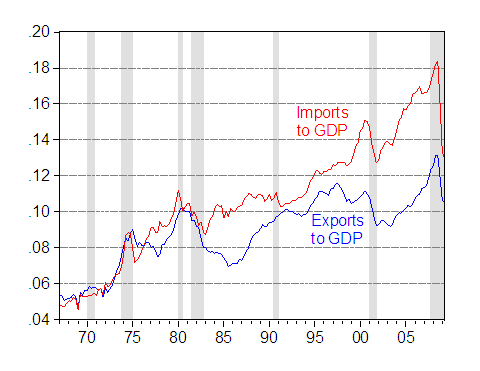
First, let’s take a look at the exports-to-GDP and imports-to-GDP ratios.

Figure 1: Non-agricultural goods exports to GDP ratio (blue), and non-oil goods imports to GDP ratio (red). NBER recession dates shaded gray. Source: BEA, GDP 2009Q2 3rd release of 30 Sep 2009, NBER, and author’s calculations.

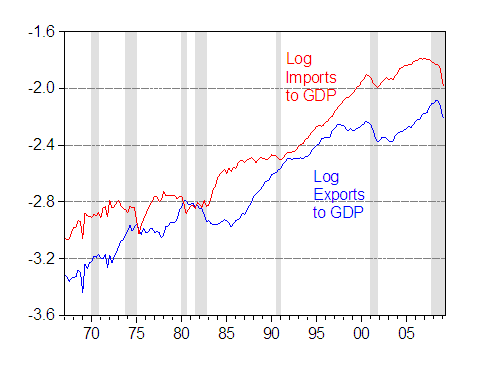
Figure 2: Log real non-agricultural goods exports to GDP ratio (blue), and log real non-oil goods imports to GDP ratio (red). NBER recession dates shaded gray. Source: BEA, GDP 2009Q2 3rd release of 30 Sep 2009, NBER, and author’s calculations.
What is clear is that in nominal terms, there has been a trend increase in trade openness, with a big (although not completely unprecedented) break at end-2008. However, nominal ratios incorporate terms of trade changes (think oil price increases in 2008); using log real ratios (I take logs because ratios of chain weighted indices don’t have a ready interpretation), one sees the jagged movements smoothed out, but trends intact.
What these graphs hint at is a break in the pace of integration. To investigate this issue more formally, I estimate error correction models for both non-agricultural goods exports and non-oil goods imports.
For exports, the specification is:
Δ exp t = θ 0 + ρ exp t-1 + θ 1 y* t-1 + θ 2 r t-1 + σ 1 Δ exp t-1 + σ 2 Δ y* t-1 + σ 3 Δy *t-2 + σ 4 Δ r t-1 + v t
Note that the rest-of-world GDP variable (y*) is the export weighted real GDP calculated by the Federal Reserve Board, for 1970q2-07q4; the 2008q1-09q2 data I estimated using a regression of first differenced GDP on a current and four lags of first differenced industrial country industrial production.
(Data sources: BEA 2009q2 3rd release for imports, exports, GDP; Federal Reserve Board for broad index of real dollar value; personal communication/Fed for rest-of-world export weighted GDP; and IMF International Financial Statistics for industrial country industrial production (nsa).)
I estimate an error correction version of this model over the 1973q3-2009q2 period, wherein there is a long run relation between the levels of imports, income and the real dollar.
In this specification, the long run elasticities are given by the ratio θ i/ ρ . When this model is estimated over the 1973q3-2008q4 period, one obtains sensible estimates (in that higher foreign income or a weaker dollar induces greater exports in the long run).
This specification fits fairly well, with an adjusted R-squared of 0.34, and the serial correlation test again failing to reject. The long run coefficients are significant, as is the reversion coefficient (ρ).
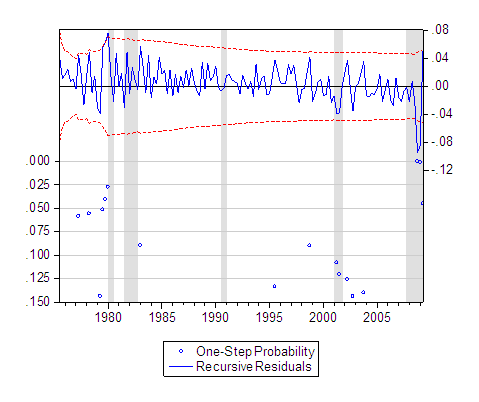
One way of evaluating whether the 2008q4-09q1 observations are anomalous, in a statistically significant sense, is to examine the recursive residuals. A recursive residual is the time t prediction error based upon the regression estimated up to time period t-1, but using time t values of the X variables. Figure 3 depicts the 95% standard error band; an observation outside that band suggestive structural instability in the regression equation.

Figure 3: Recursive residuals from standard model of exports error correction specification, 1974q1-2009q1. +/- two standard error band (red dashes).
For imports, an analogous specification is estimated:
Imp = α 0 + α 1 y + α 2 r
Where Imp is real imports, y is real income, and r is the real value of the dollar.
Δ imp t = β 0 + φ imp t-1 + β 1 y t-1 + β 2 r t-1 + γ 1 Δ imp t-1 + γ 2 Δ y t-1 + γ 3 Δ r t-1 + u t
The specification fits fairly well, with an adjusted R-squared of 0.35. The long term coefficients are statistically significant, while the reversion coefficient (φ) is also significant and negative.
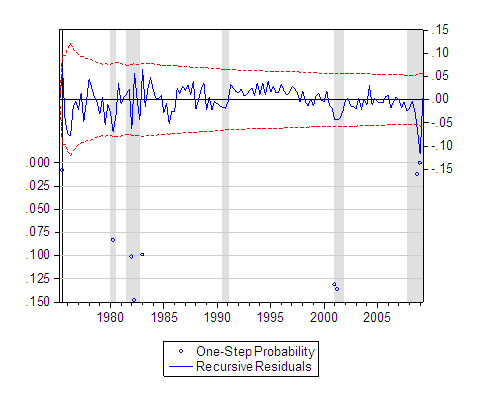
The recursive residuals are shown in Figure 4:

Figure 4: Recursive residuals from standard model of imports error correction specification, 1974q1-2009q1. +/- two standard error band (red dashes).
One observation is that using a fairly flexible econometric form (the ECM) with pretty high estimated income elasticities, I cannot track the downturn in exports and imports. (The estimated short run export income elasticity is 2.8, while the import income elasticity is 1.8.)
Now, what is true is that a constant parameter specification such as these cannot accomodate the time variation that Freund stresses — namely that income elasticities in the 2000’s have been substantially higher than in the previous decades.
If one restricts the sample to 2000q1-09q2, the short run export income elasticity falls to 2.5, but rises to 2.5 for imports. Nonetheless, the one-step ahead recursive residuals test still rejects stability for 08q4 and 09q1.
It’s possible that the addition of other regressors would, in conjunction with a shorter sample, eliminate this instability in the equations. Pursuing that avenue remains for future research.
A couple of other interesting results arise from the full sample estimation. The long run price elasticity of exports is 1.4, while that for imports is 0.6. These are substantially higher than those I’ve reported in the past [5]; however, these estimates are subject to considerable uncertainty. The 90% confidence interval for the long run exports price elasticity is [0.56,2.22] (recalling the long run elasticity is the ratio of two coefficients).
Hi, You get the order wrong with Paul; I posted Barry and Kevin and then alerted the big bloggers. Paul, the next day, linked to the VoxEU.org piece (http://krugman.blogs.nytimes.com/2009/04/06/its-1930-time/) and has been referring to it every since.
Richard
P.S. Barry and Kevin’s charts are part of a longer Economic Policy article they are writing.
Is the comparison addressing homogeneous situation (before/now) among all countries under survey such as:
Balance of payment,current accounts,debts, total credit/GDP (macro accounts,domestic accounts)
Structural changes in the GDP breakdown have occured, the share of industrial component is lessened when the financial have gained much more space .
The Evolution of the US Financial Industry from 1860 to
2007: Theory and Evidence.��
Thomas Philippon?
New York University, NBER, CEPR
Historical data from the United States shows surprisingly large variations
in the economic importance of Finance. It was high in the 1920s, but, after a continuous
collapse in the 1930s and 40s, it was down to only 2.5% of GDP in 1947. It recovered slowly
until the late 1970s, and then grew more quickly to reach almost 8% of GDP in 2006
National Bureau
of Economic Research
BULLETIN 50
APRIL 18, 1934
Recent Corporate Profits in the United States
Copyright 1934, National Bureau of Economic Re.rcarch, Inc.
SOLOMON FABRICANT
The physical volume of production and trade declined
about 18 per cent from 1929 to 1930, and 32 per cent
from 1929 to 1931 If we assume 1929 operations to
have been at ‘normal’ capacity, this index of the physical
volume of business suggests corresponding percentages of
unused capacity of about 18 and 32 in 1930 and 1931
Where now only 17.9%
http://www.federalreserve.gov/RELEASES/G17/Current/
A hasty conclusion: curves may or may not be homothetic but the crisis are far from being the same.
You cannot make sense out of global trade contraction without looking at trade finance.
cross border lending fell in half for key emerging markets around 3Q 2008.
yes its colinear, but most serious experts say it mostly shrank trade, rather than the reverse.
trade finance is complex collateralized lending, by individual bankers that know their borrowers. cannot be replaced or offset with easier monetary policy
Richard Baldwin: Thanks for the clarification. Yes, you’re right — and that’s what I meant to indicate by stating that Eichengreen (who was on my thesis committee) and O’Rourke have diligently (i.e. over time) been tracking the various indicators, now vs. the Great Depression. Apologies for being unclear.
I am not sure I see a rising trend in total trade 1990-2001 as you suggest. Import growth speeds up but export growth doesn’t look that much faster.
Our research suggests output (domestic expenditure really) at the global level actually outpaced trade growth 1990-2000. See NBER WP 15267 (http://www.nber.org/papers/w15267)
Finally, rising income elasticities are dubious. More likely is a rising elasticity of trade with respect to trade costs (Kei Mu-Yi’s point). We have more on the recent trade collapse on Vox EU “What’s Driving the Trade Collapse”
http://www.voxeu.org/index.php?q=node/3998
Chris Meissner: Thanks for the pointer. These are excellent points. In fact, in a 2005 NBER Working Paper No. 11719 (updated in 2007), I attempted to take account of vertical specialization and trade costs (specifically tariffs), with only limited success. However, my sample used here encompasses a period when some other trade costs (namely transportation costs) rose — a phenomenon I discussed in my deglobalization posts, here and here. And yet, the break is apparent only in 2008, timed with the crisis. This is why, in part, I agree with you that the high elasticities argument is not a full explanation.
Just a minor point. Shouldn’t the long-run elasticity be θi/1-&rho?
–SMG
SMG: This is an error correction model. You’d be right if this was an AR(1) specification.
The scale of the drop in global trade is mainly a function of the scale of the drop in global demand for physical goods, and secondly a function of increased government demand relative to private demand. I doubt cost structures or trade barriers have changed significantly overall to the disadvantage of international trade.
I think where people are getting confused is by comparing the recent drop in global trade to the recent drop in GDP. It’s a nonsensical comparison, as GDP is a totally different kind of statistic. GDP includes the provision of services, which are not nearly as cyclical as extraction and manufacturing.