The Peterson Institute for International Economics’ William Cline has just published estimates of equilibrium exchange rates for May 2016; the USD is 7% overvalued, while the Chinese yuan (CNY) is at its “FEER level”.
Figure 5 from the Brief depicts the amount of exchange rate change (in real multilateral terms, or in USD terms) in order to achieve FEER levels, roughly medium term equilibrium. “Down” denotes depreciation.
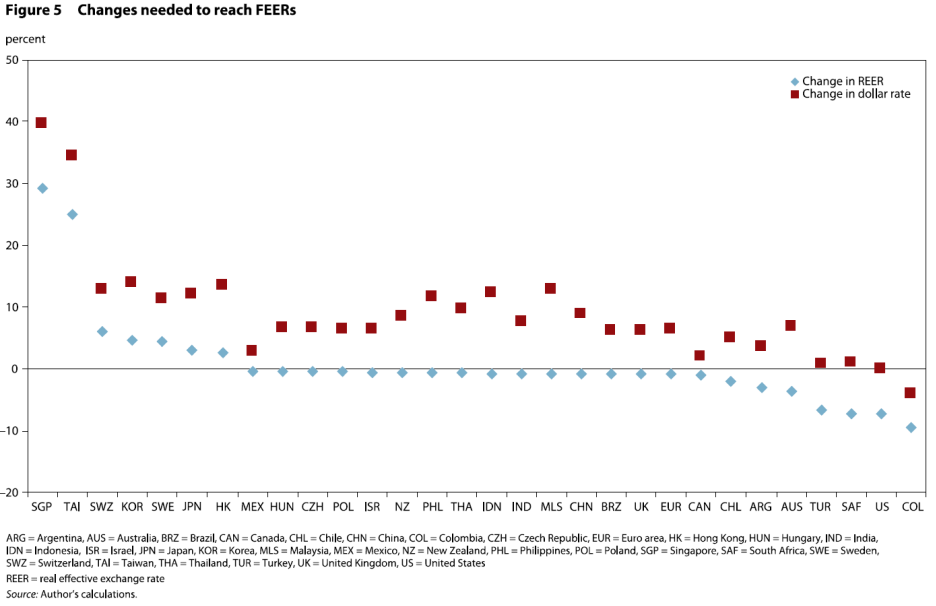
Source: William Cline, “Estimates of Fundamental Equilibrium Exchange Rates,” Policy Brief 16-6, May 2016.
Note that the USD is overvalued, in the sense a depreciation on a multilateral basis is required to achieve FEER levels. The CNY requires no such change in order to achieve FEER levels (although it needs appreciation with respect to the dollar given the USD requires depreciation to achieve FEER levels).
As noted in previous posts (see [1]), there are several many different measures of equilibrium exchange rates, and hence different estimates of currency misalignment. Indeed, even when a single conceptual measure of equilibrium exchange rate is used, one can obtain differing estimates of misalignment, depending on data sample used, empirical model specification, and estimation methodology.
The Cline/PIIE estimates are based upon the FEER (“Fundamental Equilibrium Exchange Rate”) approach, which begins with a judged equilibrium current account at full employment, and backs out — using trade elasticities — an implied real exchange rate (in this post, this fits into the “macroeconomic balance” approach). To the extent that the framework assesses equilibrium at full employment levels, the FEER is essentially a medium-run construct.
Other alternatives include the BEER (“Behavioral Equilibrium Exchange Rate”) approach, which is essentially a composite specification incorporating several models, such as real interest differential, portfolio balance, and Balassa-Samuelson approaches.
Yet another approach is to utilize the “Penn effect” — the positive empirical relationship between the real exchange rate in purchasing power parity terms and relative per capita income (also in PPP terms). This empirical relationship makes sense when prices have adjusted, and the external accounts are in equilibrium — making the predicted exchange rate essentially a long run construct. Cheung, Chinn and Fujii have utilized this approach to infer overvaluation/undervaluation of the CNY in a number of papers (see review in this post).
In ongoing work, Yin-Wong Cheung, Xin Nong and I have updated the analysis to use the most recent version of the Penn World Tables. We find that as of 2011, the CNY was at roughly levels consistent with the Penn effect. This is shown in Figure 1.
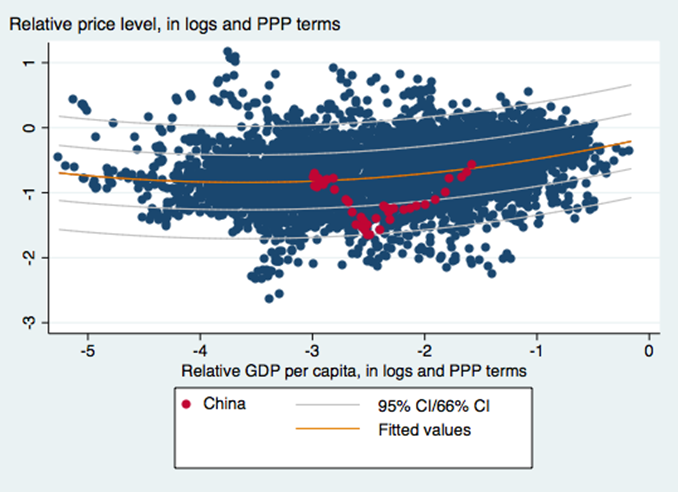
Figure 1: Log price level vs. log relative per capita income (both in PPP terms), for all developing countries. Red dots pertain to CNY. Orange line is fitted quadratic regression line, light blue lines are 66% and 95% confidence bands. Source: PWT8, and Cheung, Chinn and Nong, “Estimating Currency Misalignment using the Penn Effect: It’s Not As Simple As It Looks,” mimeo (June 2016).
With the CNY having appreciated on a trade weighted basis by about 20% (log terms) since 2011, our estimates suggest that by the Penn effect criterion, the CNY is not undervalued.