The Wisconsin Department of Workforce Development trumpeted May figures today. What if the relationship between US and Wisconsin employment over the 1994-2009M06 period persisted into the Walker era? We would have expected 60,000 more jobs than we got.
I use an error correction model estimated over the 1994M01-2009M06 period to conduct a dynamic out-of-sample forecast using actually realized values of the US employment (technically, an ex post historical simulation), and assuming US employment is weakly exogenous (one lag of first differences included); see this post for a discussion of the details. The results are shown in Figure 1.
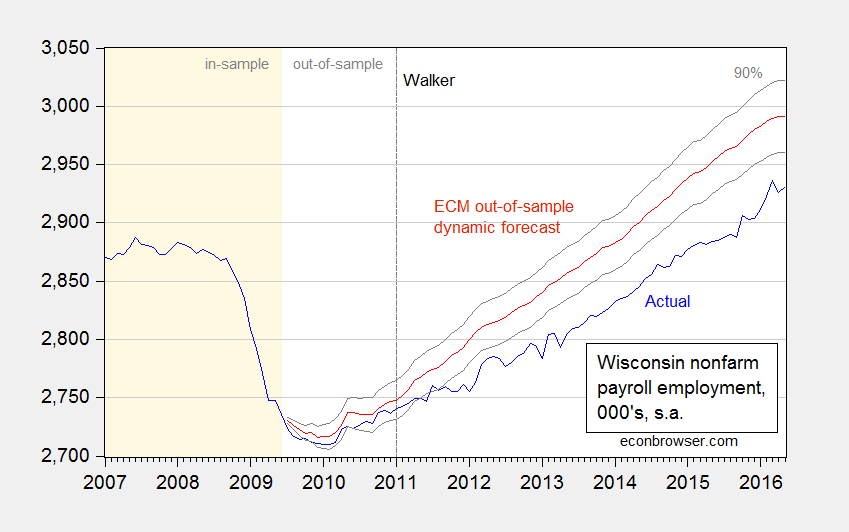
Figure 1: Wisconsin nonfarm payroll employment (blue), and forecasted (red), and 90% prediction interval (gray lines). Light tan shaded area denotes in-sample data. Log scale on vertical axis. Source: BLS, WI DWD, and author’s calculations.
Results are remarkably insensitive to including more lags, taking the sample period back to 1990, or extending the in-sample period up to 2010M12.
The shortfall is about 60,000; taking into account parameter uncertainty, it could be as large as 91,000, and as small as 29,000.
It is interesting to consider how well Wisconsin employment is doing relative to the August 2013 re-commitment by Governor Walker to create 250,000 new jobs by the end of his first term. He has clearly missed that target, but he might make the target before the end of his second term — the point estimate derived from an ARIMA(1,1,1) on log private NFP over 2011M01-2016M05 indicates November 2017 as hitting the threshold.
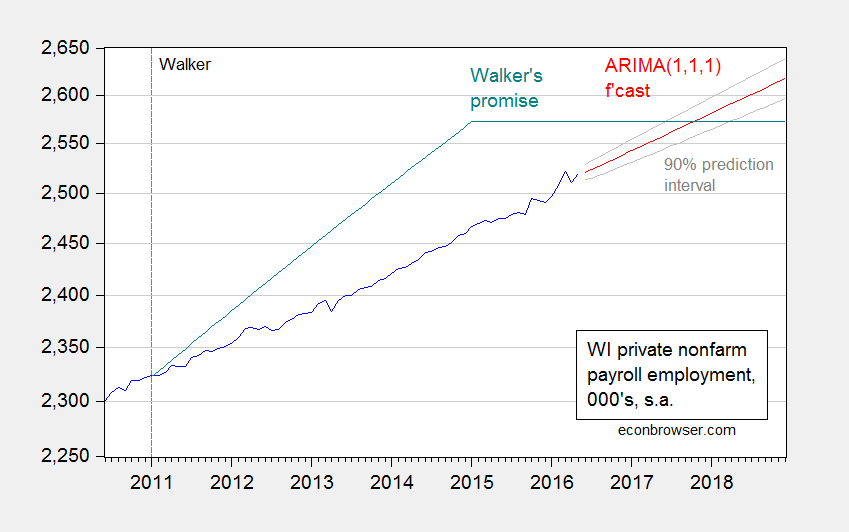
Figure 2: Wisconsin private nonfarm payroll employment (blue), and forecasted from ARIMA(1,1,1) (red), and 90% prediction interval (gray lines). Log scale on vertical axis.Source: BLS, WI DWD, and author’s calculations.
As of May 2016, Wisconsin is still 52,000 short of the target promised for January 2015. None of this is mentioned in today’s release.
How does these observations compare against the Administration’s forecasts. We have no idea, and we will have no idea for the foreseeable future. In response to my query to the WI Department of Revenue about the quarterly Wisconsin Economic Outlook, last released in May 2015, I received this very polite response:
[T]he report was becoming more irregular, and we have discontinued issuing the Outlook based upon the resources that were involved in producing it. We may still issue special reports from time to time, so please feel free to check our website in the future.
Consequently, those of us who are not privy to the inner workings of the Walker Administration do not know what the Administration is forecasting for GDP, employment, personal income, and so forth.
Double double toil and trouble. Upward doth thin gruel bubble. With nary hint of support timber fair. Yet fain cast blame on ruler’s hair. — Wm. Shakespeare
Dear Dr. Chinn,
I find this very interesting in contrast to the political scene in Wisconsin. The Governor and several GOP state legislators facing elections are highlighting the 4.2% unemployment rate, saying “the lowest rate since 2001.” For various reasons the state assembly will remain GOP while the state senate has some credible contests this election cycle. IMO state senate will remain GOP majority. This all means the Governor will once again have complete control over the next state budget. To put it politely, state funding for transportation and education and health care are in shambles. Despite all the touting of job creation by GOP, what will state tax revenue be? The financial legerdemain used to cover budget shortfalls in the past budget cycle will be more difficult to perform next time. Will all the severe cuts in education and roads translate into political fallout for the GOP? In contrast to Kansas, Wisconsin GOP has managed to hide their poor state stewardship by blaming university professors, state workers, and people using SNAP. But, they may be running out of scapegoats.
Again, thank you for tracking the employment situation in Wisconsin.
Best regards,
In Wisconsin, in May, there were 133,000 unemployed persons for an unemployment rate of 4.2%.
You imply employment is 60,000 below the counter-factual. Assuming all such gains would have come from the unemployed, then you are proposing that Wisconsin’s unemployment should number 73,000, or 2.3%.
The would give Wisconsin the lowest unemployment rate by a margin in the country. The currently leader is South Dakota, at 2.5%.
Steven Kopits: You are assuming labor force is constant. That is clearly a falsifiable assumption.
Well, then you’re compelled to argue that either I) net immigration would have been higher, or ii) labor force participation rates would have been higher. Go ahead, make your case.
Both.
http://host.madison.com/ct/news/local/writers/todd-milewski/graphics-the-shrinking-labor-force-and-wisconsin-s-unemployment-rate/article_ff82fd50-18e0-11e4-bdb7-0019bb2963f4.html
http://host.madison.com/ct/news/local/writers/mike_ivey/why-are-people-leaving-wisconsin-state-ranked-in-top-for/article_9051c464-76f9-11e2-9b37-0019bb2963f4.html
Learn to use “the Google”
NJ, NY, CT the worst. All of the have big spending governments.
You couldn’t have meant that to go to me because there is no words in those two sentences that are relevant to my links. Maybe you are having a discussion in your head and decided to post one side of the discussion online?
Can we not debate the Philadelphia soda tax instead?
My first link on Calculated Risk
http://www.calculatedriskblog.com/2016/06/oil-horizontal-rig-counts-increased.html
Soda tax. Trust me. This will get a rise out of the commentate.
http://money.cnn.com/2016/06/16/pf/taxes/philadelphia-passes-a-soda-tax/
commentati, without auto correct.
Steven Kopits: “Can we not debate the Philadelphia soda tax instead?”
You must be a delight at conferences and parties. “I’m tired of talking about what you are talking about. I demand that you talk about what I want to talk about.”
Why don’t you get your own blog? Oh, wait. I see you do but no one ever reads it. That explains everything.
Joseph –
I am usually among the top rated presenters at conferences where I speak. For instance, at the Platts oil conference, I gave the keynote lunch speech and was the top rated speaker, with an average survey score of 9.5 of 10.
As you know, I write regularly for CNBC and the UAE’s National. I send our regular emails to a select group of recipients. There is always a tension between emails, your own blog and third party publishing. To build and maintain readership at your own blog, you have to publish at least daily. That’s too much for me, certainly in addition to CNBC and National pieces. I’d note that I’m often near the of the deck in terms of views on these two websites when I do publish. Emails are easier, because the quality standard is lower and the format more free. I can send out no more than a graph and a sentence, for example.
****
As you can see above, I did in fact contribute to this blog post. The soda tax, from my perspective, is interesting because it melds policy and politics, and is somewhat novel. For example, it’s highly regressive. It is anti-business. It may qualify as a behavioral nudge. There are definitional problems of what constitutes a ‘soda’. There are question of how it impacts consumer buying decisions more broadly (for example, it enhances the position of the Wal-Mart or Costco just beyond Philly city borders). Put it all together, I think this is a ‘red meat’ topic for Econbrowser, one which brings out both the policy wonk and ideologue in all of us. That’s why I suggested it.
…top of the deck…