The Bureau of Economic Analysis announced today that U.S. real GDP grew at a 1.2% annual rate in the second quarter. Not good news.
The U.S. growth rate has historically averaged over 3%. Many of us have concluded that a long-term growth rate around 2% may be more realistic to expect at this point. But the last three quarters have fallen significantly below even that new lower bar.
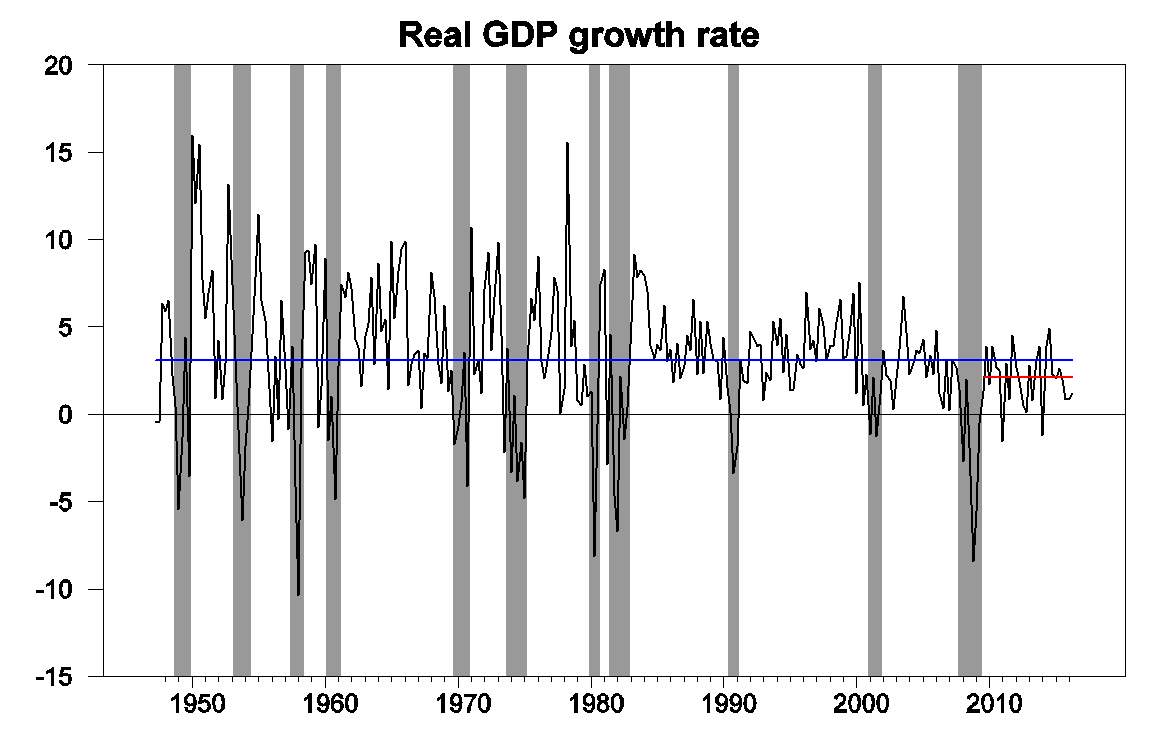
Real GDP growth at an annual rate, 1947:Q2-2016:Q2, with historical average (3.1%) in blue and post-Great-Recession average (2.1%) in red.
I had been among those who attributed the anemic first-quarter numbers in part to seasonal adjustment problems. This argued for some spring-back effect expected for the second quarter, to which reality has now answered with a cold shower. The Federal Reserve Bank of New York nowcast had been anticipating 2.2% growth for Q2. The Atlanta Fed nowcast was 1.8%, and the Wall Street Journal economists’ survey called for 2.6%.
Our Econbrowser Recession Indicator Index is starting to register more concern, with today’s data bringing it up to 22.5%. The index uses today’s release to form a picture of where the economy stood as of the end of 2016:Q1. However, that’s still significantly below the 67% threshold at which our algorithm would declare that the U.S. had entered a new recession.
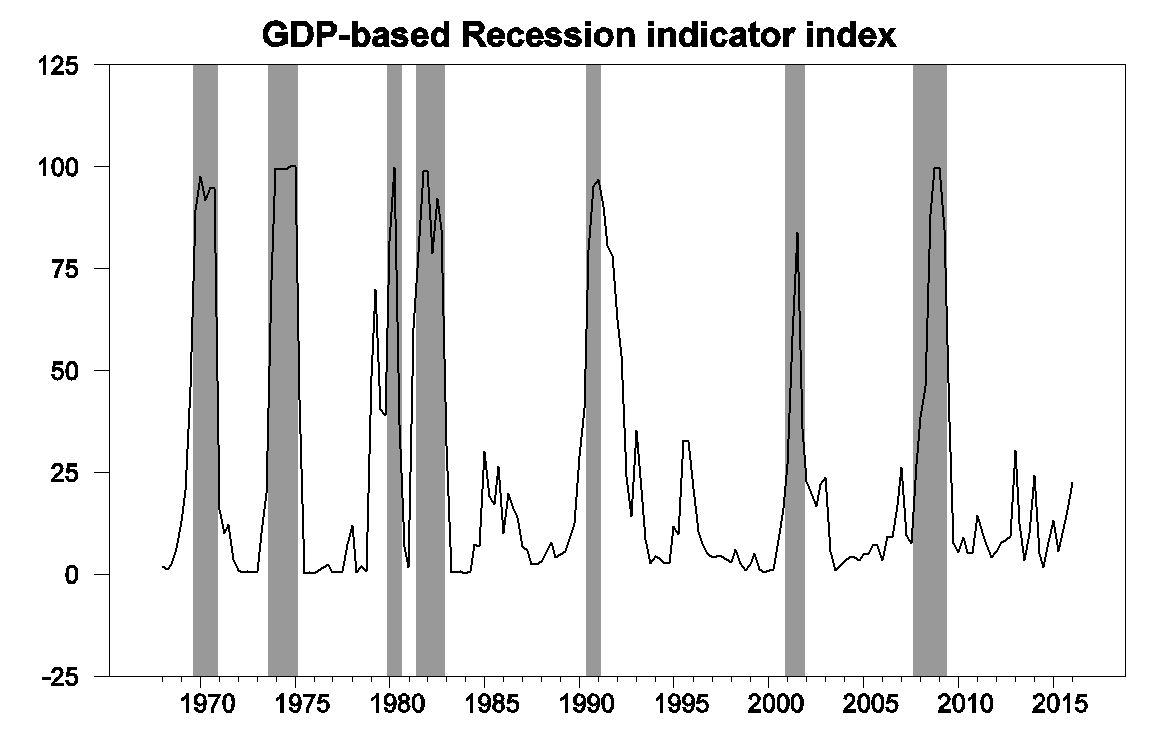
GDP-based recession indicator index. The plotted value for each date is based solely on information as it would have been publicly available and reported as of one quarter after the indicated date, with 2016:Q1 the last date shown on the graph. Shaded regions represent the NBER’s dates for recessions, which dates were not used in any way in constructing the index, and which were sometimes not reported until two years after the date.
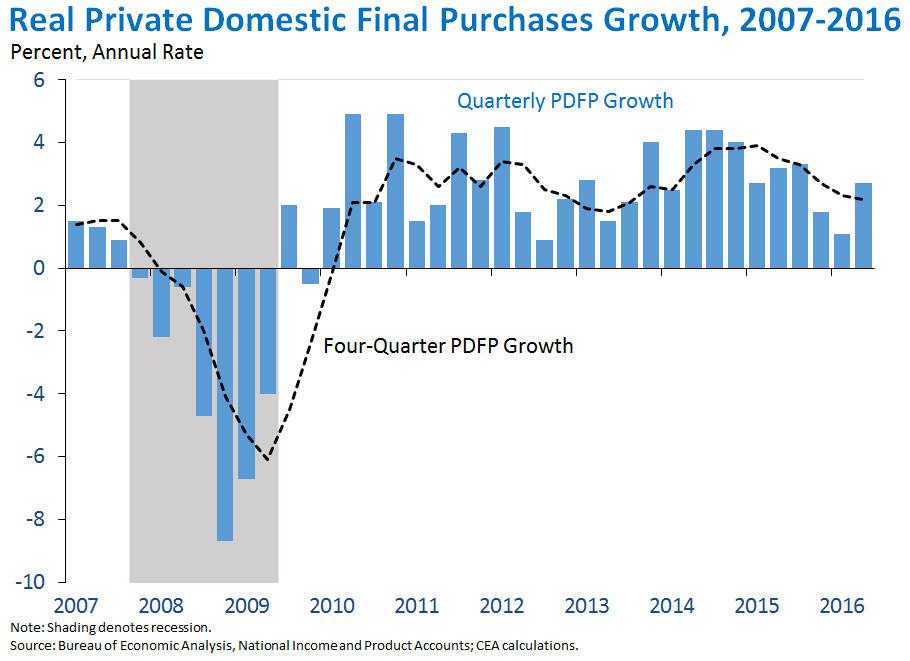
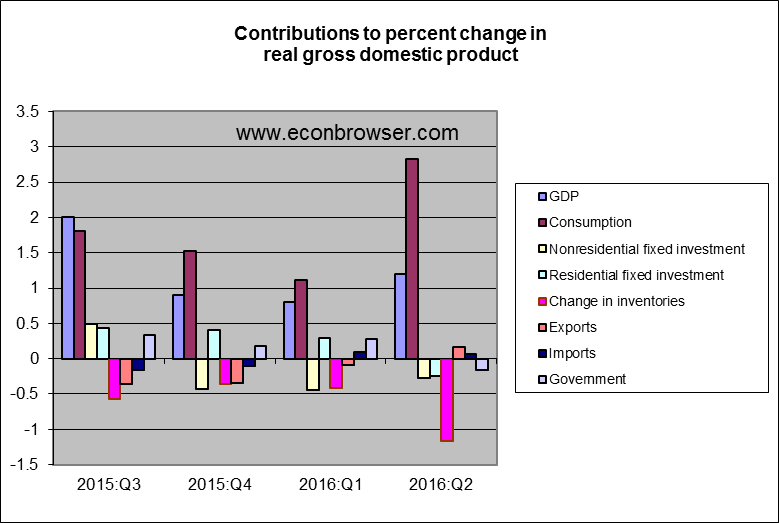
They key factor in today’s weak numbers was a drawdown of inventories. Real final sales grew at a 2.4% annual rate with half that growth being met by selling out of inventory rather than new production. Jason Furman, Chair of the White House Council of Economic Advisers, emphasizes that inventory changes are the most volatile and least persistent component of GDP growth, and sees a steadier and more reassuring picture if you focus just on real final domestic purchases.
Still, nonresidential and residential fixed investment also were both lower than they had been in the first quarter. The latter is where I still think the prospects for a better second half may be found.
But by “better”, I don’t mean 3% growth.
This should not be surprising. The Fed has been following an overly tight monetary policy–like raising the interest on excess reserves by 25 basis points late last year. Our economy was beginning to get use to a 4% growth rate in nominal GDP but this has declined to less than 3% over the past several months.
https://thefaintofheart.wordpress.com/2016/07/29/the-fed-is-failing-us-ngdp-growth-crash/
Could this be the election? The animal spirits hedging their bets on the very real chance of having to deal with the effects of a wild card president?
Economists with tenure who make $150,000 a year for teaching 9 hours of classes per week have no idea what the real world is like.
The economy is collapsing for real people in the real world. If you can find a job today, it’s typically a zero-hours contract job where you must call in by phone each day to find out if you’re going to work. You never get more than 30 hours a week and that’s not enough to pay for a typical apartment in a big city. So everyone has to get 2 or 3 jobs.
Employers have eliminated unions and even highly educated professionals are now being treated like part-time contract slaves, with programmers and PhD professors getting fired and hired back as “associates” and “contractors” who make less money and get no benefits like health care.
It would prove instructive if Professor Hamilton were to live the life of one of the associate professors at his university — a life in which he would barely scrape by with no health care or sick leave or maternity leave, making perhaps a couple of thousand dollars for every unit he taught. Professor Hamilton would watch his income plummet by 80%, his hours skyrocket by a factor of at least 500%, and all his lavish benefits would disappear. After a month working as one of the part-time sub-minimum-wage associate professors at his college, Hamilton would be on the barricades holding a sign that reads GENERAL STRIKE AGAINST THE CAPITALIST IMPERIALIST PIGS instead of explaining that “the anemic first-quarter numbers [were due] in part to seasonal adjustment problems.”
Out here in the real world, the U.S. economy is falling apart and a revolution is building. The top 20%, who continue to do very well, have no clue what’s going on because everyone they know is doing wonderfully well and all those homeless formerly middle-class people holding up cardboard signs reading LOST MY JOB PLEASE HELP at freeway on-ramps are simply invisible to people like Hamilton.
There’s been tremendous progress in macroeconomics, microeconomics, international trade, money & central banking, labor economics, etc.. It’s up to the policymaker to use the value contributed by the economics profession appropriately. Unfortunately, there are too many powerful politicians-lawyers, who’ve done a poor job for too long.
Yes, that’s nice to live in an ivory tower.
But still I doubt that Trump will win, as the MSM is in HRC’s hand.
Proxy war with Russia in Syria is on Clinton’s evil mind.
That is to say, the military-industrial complex will support
her too, guess the election outcome is clear.
I think you mean “adjunct professors” rather than “associate professors.”
mclaren,
This is an ignorant and unfair ad hominem attack on Prof Hamilton.
Economists who become full professors at major universities do not get there by teaching 9 hours of classes a week. They work incredibly hard to get where they are, much harder than the average American worker. To become a full professor at a major University, you have to compile a substantial research record, which is a 7 day a week job. Even those who are willing to put in the necessary hours can’t necessarily succeed, because the academic industry is highly competitive and you have to be very good as well as hard-working. Contrary to popular belief, academics have to work just as hard the day after they get tenure as they do the day before.
Prof Hamilton has established a highly impressive research record, representing decades of difficult, high quality work. In addition, he is the author of Time Series Analysis, which, although published in 1994, is still the essential reference for anyone involved with time series econometrics. An academic economist with this level of achievement will typically earn more than 150K per year as a full professor at a major university.
As 2 slugs pointed out, you are confusing an adjunct professor with an associate professor. An adjunct professor is a contract worker who is hired to teach a particular, usually low level course. All the adjunct professors I’ve ever known already had full time jobs and were doing it both to supplement their incomes and because they enjoy teaching. (I’d bet that 2slugs has been or is an adjunct professor somewhere.) There are of course adjunct professors whose only job is to teach courses, without a full time position or benefits. They are usually found in humanities areas such as history, english literature, etc. This phenomenon reflects the dismal state of those academic markets, in which there is a huger oversupply of PhDs.
Prof Hamilton is merely analyzing the current GDP numbers for what they mean about the current state of the economy and for what they might portend for the future. You cannot infer that he isn’t sympathetic to the plight of people who are struggling just because he’s doing the job that professional economists do. I’m very confident that he’s sympathetic. In this blog, however, Prof Hamilton focus is giving you high quality analysis that you’d generally have to pay a lot of money subscribing to a service to receive. You are getting it free. Stop complaining and say thank you.
How does someone like that get to a blog like this?
The 2.4% growth in final sales is somewhat misleading. The caveat is it was fueled by an 8.4% rise in durable goods consumption thanks to a jump in recreational goods and vehicles and in auto sales. Anyone who read Ford’s earnings report yesterday knows the latter won’t last, especially after the CFPB’s announced changes in debt collection rules. No green shoots and hidden positive surprises. A very weak report that confirms a bad trend.
I am with McBride, better say ‘no worries’:
Quote: ‘Although there was an investment slump in Q2 – no worries – residential investment will pickup (still very low), and non-residential (except energy) will also pickup. Investment in inventory has been negative for five consecutive quarters, and that should make a positive contribution soon.’
Would rather worry about evil Hillary becoming President, than GDP Q2 numbers.
The U.S. growth rate has not averaged over 3% since 2007. The reason is that the level of debt – which in 2008 soared to a new plateau on the basis of deficit spending policies rooted in Keynesian theory – now precludes such growth. Growth will be suppressed perpetually from now on unless and until debt is deleveraged. Even if appropriate action were taken immediately, it would take decades (plural) for growth to get back to 3%. Yet current central bank policies are diametrically opposite the right policies. The great flaw of Keynesian theory now stands exposed to all whose beliefs are fluid enough to see. Keynesianism does not, nor did it ever, take cognizance of the long-run.
Moreover, in this new era of debilitating debt that dates from the mid-80s, both frequency and severity of financial crises around the globe have been on the rise. So it’s predictable that with each next crisis, potential growth will fall sequentially onto ever lower tracks. This because debt will stair-step sequentially to greater heights in the wake of each coming recession. As it stands now, the endpoint will be total financial system collapse and then chaos beyond comprehension.
I suspect, as lay person reading a lot of economics and business blogs, that there are a lot of reasons besides the debt left over from the financial crisis. Demographically, the labor force has been growing slower over the last 10 years, large numbers of baby boomers who have not retired have entered less productive work years post ’55 as the effects of declining health and the aging process affect work performance on average, and immigration, both legal and illegal, have declined during this Long Depression. In addition, Government investment continues to decline, time loss to traffic and commuting continues to increase and with incomes nominally rising very slowly there is not a a big spur from private Aggregate Demand to spur investment. And the Fed has been tightening since the late Spring of 2103 and the “Taper Tantrum.” Still,since most of the rest of the world has been even stupider in their worship of “Austerity” and “Classical Economics,” U.S. growth, on a per capita basis, has been better than most of the developed and near developed world. http://data.worldbank.org/indicator/NY.GDP.PCAP.KD.ZG
It would be an interesting study and or paper to look at the Feds forecasts for growth, inflation, employment, and interest rates at the beginning of each year for the last 10 years, and see how every year their models have been overly optimistic about growth and pessimistic about the inflation rate and since the models used by the Fed are consistently predicting wrong in one direction, what might be the problem with the models.
I do find it amusing that every time Yellin and Fisher insert hawkish language into the Fed post-meeting statement, the Bond market and the economy deliver results that make those statements sound absurd.
“As it stands now, the endpoint will be total financial system collapse and then chaos beyond comprehension.”
This apocalyptic scenario is in noone’s interest and is extremely unlikely to come about. It’s much more likely that the central banks have just been working through options that don’t seem to work to bring about growth. They will likely settle on some form of helicopter money to get people to spend again.
All we’re lacking right now is the willingness of people in sufficient numbers to buy stuff they don’t need. Add in people who can’t afford stuff they need, and shopping coupons might work wonders. It will suck being a creditor when that comes about, but everyone else will do OK.
Based on these GDP numbers, Prof Ray Fair of Yale University has updated his presidential prediction model, which is now forecasting a strong Trump win, with only 45% of the vote share going to Hillary.
Left wing film maker Michael Moore agrees, saying
‘I am sorry to be the bearer of bad news, but I gave it to you straight last summer when I told you that Donald Trump would be the Republican nominee for president. And now I have even more awful, depressing news for you: Donald J. Trump is going to win in November. ….. Go ahead and say the words, ‘cause you’ll be saying them for the next four years: “PRESIDENT TRUMP.”’
Moore’s entire analysis is worth reading.
This is the new normal.
GDP growth under Obama has never exceeded 3% (not since Hoover has that happened ).
http://bea.gov/iTable/iTable.cfm?reqid=9&step=3&isuri=1&904=1930&903=1&906=a&905=2016&910=x&911=0#reqid=9&step=3&isuri=1&904=1930&903=1&906=a&905=2016&910=x&911=0
For Jeff Frankel,
I did what the authors of Presimetrics (Kimel & Kanell) did to see if it made a difference by removing the first (and second years) of an administration to see if their policies are working. In Bush’s case, he inherited an economy in fairly good shape from Clinton, and in Obama’s case, he inherited a bad economy from Bush; that way it shows if their policies are working; there was not a lot of difference from the first number.
Series LNS14000000
U-3 Unemployment
http://data.bls.gov/timeseries/LNS14000000
Bush 2001 – 2008 5.3%
Bush 2002 – 2008 5.3%
Bush 2003 – 2008 5.3%
Obama 2009 – 2015 7.8%
Obama 2010 – 2015 7.6%
Obama 2011 – 2015 7.2%
===
Series LNS15000000
Not in Labor Force
http://data.bls.gov/timeseries/LNS15000000
Bush 2001 – 2008 75,887
Bush 2002 – 2008 76,538
Bush 2003 – 2008 77,176
Obama 2009 – 2015 87,981
Obama 2010 – 2015 89,042
Obama 2011 – 2015 90,062
===
Gross Domestic Product
http://bea.gov/iTable/iTable.cfm?reqid=9&step=3&isuri=1&904=1930&903=1&906=a&905=2016&910=x&911=0#reqid=9&step=3&isuri=1&904=1930&903=1&906=a&905=2016&910=x&911=0
Bush 2001 – 2008 2.1%
Bush 2002 – 2008 2.3%
Bush 2003 – 2008 2.4%
Obama 2009 – 2015 1.5%
Obama 2010 – 2015 2.2%
Obama 2011 – 2015 2.1%
===
Series LNS11300000
Labor Force Participation Rate
http://data.bls.gov/timeseries/LNS11300000
Bush 2001 – 2008 66.2%
Bush 2002 – 2008 66.2%
Bush 2003 – 2008 66.1%
Obama 2009 – 2015 63.8%
Obama 2010 – 2015 63.6%
Obama 2011 – 2015 63.3%
Not since Hoover has that happened
Meant to say that Obama is the first president since Hoover that has not had a single year of GDP growth over 3%.
this is a fake problem.
http://www.slideshare.net/genauer/sampler-2-of-imf-2014-weo-data-plots
plot 8, 9 show that there is no long term growth of GDP per capita in PPP above 2% for the US / UK
The US got a temporary shot by cheap credit after 1998, because Asian countries were forced to buy US bonds.
And this is now getting neutralized.
Nothing to be seen, please move on
Alex: “GDP growth under Obama has never exceeded 3% (not since Hoover has that happened ).”
There is a simple explanation for that — Republicans’ ignorant policy of austerity during a recession.
Since 2009 the number of federal, state and local employees has declined. This is the first time in history that this has occurred during a recession. Contrast this with the Reagan and G.W. Bush recessions.
Since 2009 the deficit and spending has declined at the fastest rate in history. Never before has spending declined so rapidly during a recession. Contrast this with the record deficit increases and spending during the Reagan and G.W. Bush recessions.
Joseph, no argument on austerity.
A perfect example is IL. Billionaire Bruce Rauner (R) was elected governor in 2014 to fix things and rather than claw back some of the $5 billion in tax cuts, subsidies, etc that IL granted corporations in previous years, he immediately imposed austerity cutting social services for seniors, education assistance for students, etc. This led to a budget fight with Democrats and for a year there has been no budget. His and the IL-GOP poll ratings have dropped quite a bit. Even Crain’s Chicago Business (a well-respected business journal) who originally endorsed him came out last month and admitted in their paper they made a mistake endorsing him.
Rauner (R) could be the one who saves the Democrats in IL.
In downstate IL, the Democrats have lost their appeal from old to young. The older Democrat voters grew up with FDR. Whenever Obama or Hillary is on tv, they change channels or mute it. The Democrat brand has gone south downstate.
As someone pointed out last year, the sad thing is that the only good economy most people will ever know in their lives is the Clinton years (1993-2000), and things don’t look to get better any time soon, if at all.
The government has a priorities problem.
If you have time, here’s something I posed to Professor Jeff Frankel:
how much have the Republicans & Democrats spent on war (and related) & tax cuts since 2001?
By my (ball park) estimate, it is close to $79 trillion ($38.6T + $38.8T) over 15 years.
http://newdealprogressives.org/blog/2016/07/07/honest-campaign-if-elected-i-promise-to-give-trillions-to-the-rich-spend-trillions-on-war-and-cut-everything-for-working-people/
These are insane numbers.
The number of countries with US military involvement under Bush was 4; under Obama it’s 15 and more if you include how the US is using NATO in Europe, not to mention the US and china relations.
http://newdealprogressives.org/blog/2016/07/16/fight-club-the-u-s-wars-continue-to-increase-in-number-exponentially/
Oh well, off the soapbox now.