Political Calculations makes some more ([1], [2]) elementary errors with chained quantities, to arrive at incorrect — and misleading — measures of real GDP excluding government consumption and investment.
First, here is the figure that Political Calculations displays:
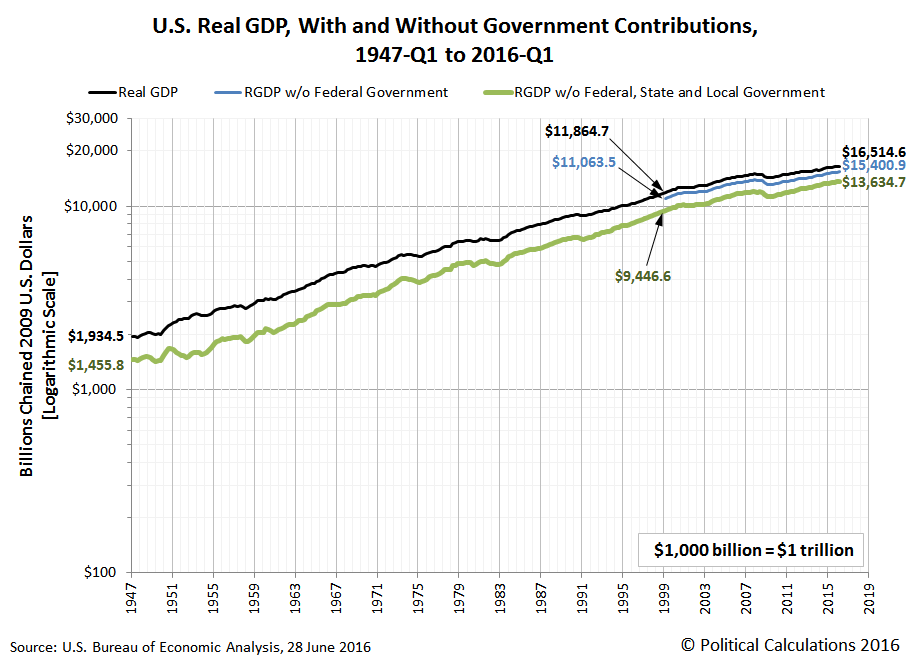
The real GDP ex-government was apparently calculated by simply subtracting Chain weighted government consumption and investment from Chain weighted GDP. (I verified this point by doing the subtraction myself, and matched his 2016Q1 figure.)
As is well known by professional economists, one cannot simply subtract one Chain-weighted measure from another, unless one is working with the reference period (i.e., looking only at 2009 values when the units are expressed in 2009 dollars.) Otherwise, one needs to use some sort of approximation method, such as this one.
Below is the correctly calculated series (in red) as compared to the incorrectly calculated (green) by Political Calculations.
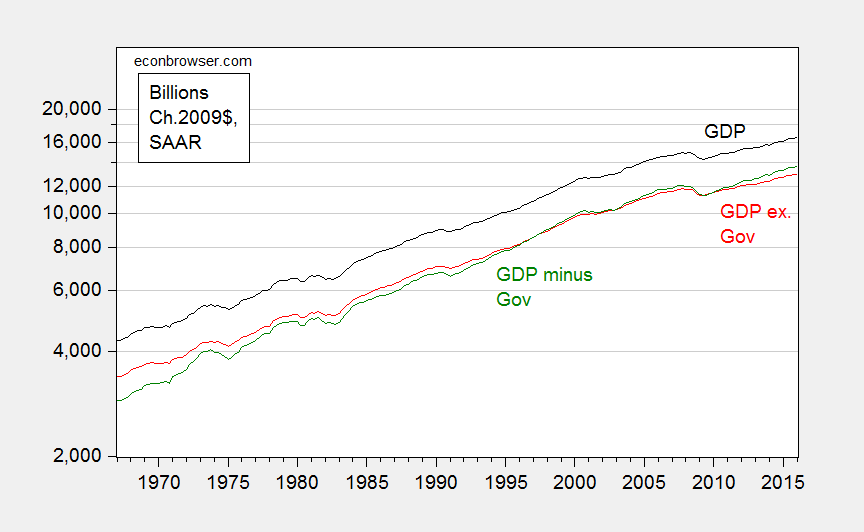
Figure 1: GDP (black), simple arithmetic subtraction of government consumption and investment from GDP (green), and Törnqvist approximation for GDP ex.-government consumption and investment (red), all in billions of Chained 2009$. Source: BEA 2016Q1 3rd release, and author’s calculations.
The error looks small in the graph, partly due to the log scale. In reality, the deviation is substantial, 4.9% (log terms) in 2016Q1. In other words, last quarter, actual ex.-gov GDP was 4.9% lower than what Political Calculations had asserted.
One might be tempted to conclude that if one examined data around the reference year (2009), there’d be little problem along all dimensions. This temptation should be resisted; for instance, calculating contributions to GDP growth using the simple-subtraction method would lead to very different inferences than if one used the correct measure. This is shown in Figure 2.
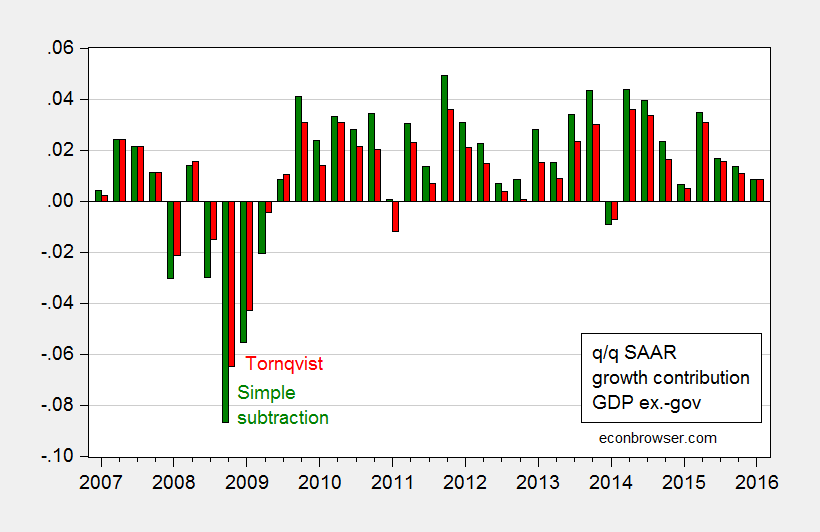
Figure 2: Quarter on quarter contribution of real GDP ex.-government consumption and investment to real GDP growth (red), and contribution of simple subtraction of government consumption and investment from GDP (green), at annualized rates, in percentage points. Source: BEA 2016Q1 3rd release, and author’s calculations.
In 2009Q1, non-government GDP was contributing -5.5 percentage points using the incorrect measure, and -4.3 percentage points (q/q SAAR) using the correct. The difference is even more stark moving to 2008Q4: 8.7 percentage points versus 6.5 percentage points.
On a related note, Political Calculations also makes a methodologically similar error in this post, as discussed here.
Dear Menzie,
Thank you. I didn’t know this and would have done what they did.
Julian
Julian: You’re welcome. Life was simpler in the days of fixed weight deflators…