A cautionary tale for my undergraduate economics students
Reader Steven Kopits wonders why, in order to show the relative prominence of government spending, I don’t merely take the ratio of one real index to another real index. Specifically, he admonishes me:
I find this presentation confusing. … Is it not possible to present this data as a simple percent of GDP?
The answer is no. The reason is that real quantities (in the national income and product accounts) are measured using chain-weighted series. From Whelan (2000):
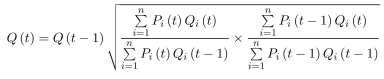
To address the problems with its fixed-weight measures, in 1996 BEA began calculating real GDP and all other published real aggregates according to a chain index formula. Specifically, BEA now calculates the growth rate of real aggregates according to the so-called “ideal” chain index popularized by Irving Fisher (1922):
The gross growth rate of the real aggregate at time t is calculated as a geometric average of the gross growth rates of two separate fixed-weight indexes, one a Paasche index (using
period t prices as weights) and the other a Laspeyres index (using period t − 1 prices as weights.)
The weights change over time, mitigating the problem with substitution bias. However, a consequence of measuring quantities using this approach is the loss of additivity. The sum of the chain-weighted components does not equal the corresponding chain-weighted aggregate. This point is highlighted in Figure 1.
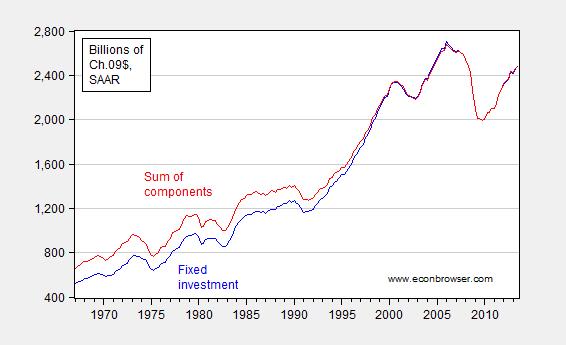
Figure 1: Fixed investment (blue), and sum of equipment, structures, intellectual property, nonresidential investment (red), billions of Ch.09$. Source: BEA, 2013Q3 3rd release, and author’s calculations.
This problem occurs as long as relative prices change; the problem is more pronounced the greater the changes in relative prices.
Now, suppose one wanted to measure the importance of one component by taking a ratio — for instance equipment investment to total fixed investment. One could calculate the ratio of nominal equipment to nominal fixed investment. This, however, would not be informative regarding the quantities. Because of the non-additivity aspect of chain weighted measures, one can’t take the simple ratio of real variables.
However, one can compare the growth rates of the two series, for instance Z and W. Taking log ratios accomplishes this goal. Consider the difference in cumulative growth rates.
log(Zt/Z0) – log(Wt/W0) = log(Zt/Wt) – [log(Z0/W0)]
The right hand side of the expression is the log ratio of Z/W, minus a constant, in the [square brackets].
Now consider Figure 2, which shows the nominal ratio and the log ratio of real series.
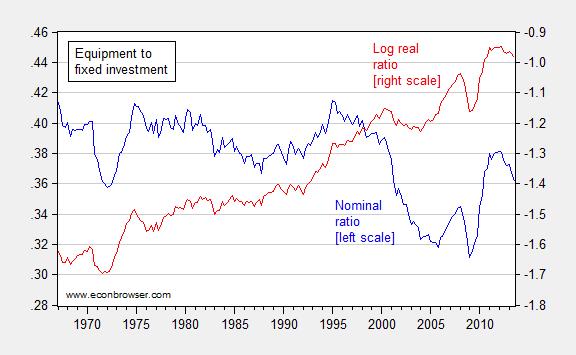
Figure 2: Ratio of nominal equipment investment to nominal fixed investment in (blue, left scale), and log ratio of real equipment investment to real fixed investment, in Ch.09$ (red, right scale). Source: BEA, 2013Q3 3rd release, and author’s calculations.
The level of the right hand scale has no meaning, except that an upward trend indicates equipment investment grows faster than aggregate fixed investment. The difference between the initial value and the final is equal to the cumulative growth differential.
Note that the use of nominal magnitudes would completely obscure the trend increase in real equipment investment as compared to real fixed investment. On the other hand, merely taking the ratio of real equipment to real fixed investment would lead to an overstatement of the importance of equipment at the beginning of the sample, given the sum of the components exceeds the aggregate fixed investment by about 20%.
The bottom line: when discussing variables like GDP, and its components, understanding of their measurement in practice is useful.
Why wouldn’t a ratio of nominal variables be informative about quantities? If the price of the variables in the numerator and denominator were the same then one should get back quantities.
You forgot to add that the non-additivity of chained-type indexes is the reason why the NIPA published
– a line called statistical discrepancy at the end of each chained-type table
– a table called “contributions to the rate of growth…”
– a table called “percentage shares…”
What I still don’t get is whether or not it is OK to regress (for instance) Y on C and I in log real, chained-type terms, or if this regression is only valid in nominal terms. If run in real terms, wouldn’t you have an overstatement at the beginning of the sample, and hence a problem with the stability of the coefficients?
I understand, Menzie, that you’re trying to determine the “real” value of Federal consumption expenditures. I think this is highly problematic.
What is the “real” value of defense spending, for example? Its true “consumption” value is the wars we didn’t have to fight, that is, its deterrent value. How do you measure that? If we could have fought no more wars with two fewer aircraft carrier groups, then those two groups are pure, unadulterated waste with a material opportunity cost piled on top. But no one knows what the counter-factual would have been, so we have no idea whether our defense budget is ultimately well spent or not.
If you can give me a plausible framework for measuring the consumption value of defense spending–itself a significant component of government consumption as I understand it–well, I’m all ears.
Barring that, however, we’re pretty much left with expenditure. I can tell you how much the government spent on stuff, but I have no idea how much it was worth, because it wasn’t subject to a market test.
Moreover, assessing the value of consumption seems unnecessarily complicated. As Interested points out, we have nominal expenditure for Federal spending, as well as nominal GDP. It’s a simple matter of division, no need for chaining anything, best I can tell.
Here’s the chart I think is easier to understand (not updated), from dshort (who makes great charts):
http://globaleconomicanalysis.blogspot.com/2012/08/government-spending-as-percentage-of-gdp.html
And while we’re at it, an interesting analysis from Heritage:
http://www.heritage.org/research/reports/2013/08/federal-spending-by-the-numbers-2013
Now, it is fair to say that govt spending as a share of GDP has been falling. It is also fair to say that it remains near historic highs, and that the deficit remains huge. It is also fair to say that Obamacare is a big, new middle class tax for a lot of people–and it’s off balance sheet. By rights, your health plan should show what portion covers you actuarially, and what portion represents the “tax” that Justice Kennedy tells us it is; and that tax should be shown in government accounts.
kopits
“It is also fair to say that Obamacare is a big, new middle class tax for a lot of people–and it’s off balance sheet.”
really? no increase for me. did you have an increase? did obamacare cause an increase to some folks? yes. but it was a small number of people, mostly those on individual policies-the vast majority are on employer sponsored policies who were not affected by obamacare one bit. you guys act like any increase this year was totally due to obamacare-and the price hikes you have had for the past decade, and their causes, have ceased to exist in the obamacare era. hogwash.
an interested reader: Well, yes, if the price level is the same for both the variable in the numerator and the denominator for all time. That is essentially the same as saying that there are no relative price changes.
Olivier: I guess it would depend on the theoretical model underlying the regression. Theory doesn’t always give a specific functional form — like linear in levels versus log linear– without additional auxiliary assumptions usually made for tractability.
Steven Kopits: I think you have now changed the terms of the debate. In our previous exchange, you asked:
Now you bring up the metaphysical question of whether there is a way to measure “real” quantities, if the product is not mediated through the market. Thank goodness the credit default swaps were mediated through the market so we had a good idea of their price….
I must say it’s a remarkably nihilistic view you have of measurement. We have nominal figures for investment, we have nominal values for GDP, I look forward to seeing your next report measuring investment in oil and gas sector in nominal dollars, and ignoring relative price changes in oil drilling equipment, etc.
baffling-
could you pass me some of that kool-aid brotha? It is undeniable that ObamaCare is a indirect tax on the healthy and young.
Ratios of chained dollars are OK for one or two years away from the reference year. For longer periods the non-additivity distorts the results.
As Menzie points out, growth rates are the only way to determine changes in relative importance of real variables (quantities) over time. This can be done with either chained dollars or quantity indexes.
Those who really need chained dollars for some reason for short periods far from the official reference year can calculate these by picking their own (presumably distant) reference year and “chaining” the current dollar values for that reference year by the growth rate of the quantity indexes.
anonymous, it’s really only a tax on the young and healthy who a) chose to be irresponsible from the beginning and never even had health insurance and b) had policies from the individual market. and chances are, if that person falls into one of those two camps, the insurance now available will have a subsidy because their yearly income was meager anyways. a young gun making $60+k a year and is foregoing health insurance gets no sympathy from me-that is plain irresponsible and selfish.
it is truly baffling the number of people who are not affected by obamacare at all, have their own insurance, but continue to insist that it is increasing cost. and yet their own costs are unaffected. worry about your own finances, and let those who may be affected actually make their case against obamacare. why do they need you as an advocate?
Baffs –
I’m under a university plan. We have seen material increases in our health premiums due to internal NJ issues, not Obamacare. But let’s wait and see what’s the effect when Obamacare gets to this level.
Justice Kennedy called Obamacare a tax. Let’s know what that number is. But you’re right, I think that people are equally entitled to know how much they are receiving in subsidy.
The issue is this: Government spending is primarily motivated by political, not economic, considerations. Thus, it is very difficult to judge the economic value of such spending, as it was non-economic is its very concept.
Let me give you two illustrative examples. We prepared a report recently for the US government. Best I can tell, it will be used primarily by high school students for term papers, but we spent months and hundreds of thousands of dollars on it. Personally, I think the value-added to the economy was minimal.
By contrast, we’re spending two weeks to develop the strategy for a publicly listed NASDAQ company. There’s a probabilistic aspect to this, but an expected c/b basis, I think the money well spent by the client.
The government project has no market test, and at best you can measure the real inputs used to create the report. The other has a clear market test, and a clear expected benefit to the client. One can be reasonably measured, the other cannot.
Thus, you are correct is my nihilism regarding government spending: It’s not economic is its very foundations. On the other hand, if we implemented the FAA, then we could presume that policy would have economic foundations, and therefore we could better assume your methodology. So, if you want to put some weight behind the FAA, I’d be pleased to concede the argument.
But as it is, I think it’s punishingly difficult to ascribe value to government spending with any precision, and therefore I believe we’re essentially limited to a cost approach. It’s not what we’re getting, it’s how much we’re spending.
“It is undeniable that ObamaCare is a indirect tax on the healthy and young.”
How so? Do healthy people never get sick? Do young people never get old?
I suppose there is the occasional healthy 25-year-old who dies in a auto accident, but I haven’t heard of any coming back from the grave complaining about their wasted insurance premiums.
As for oil, it’s about 4.5% of GDP, nominal on nominal. That’s the measure I use for estimating carrying capacity (which puts it at $105 or so Brent for the US). It’s an interesting question whether this is moving up or the US is toggling back into price inelastic demand mode. I’m not sure, but oil consumption was up 3.1% for the last three months yoy. That’s a very big step up; not sure how it will play out.
As for oil field service prices. The productivity of capital at the oil majors has fallen by a factor of five since 2000. In that year, the oil majors produced 14 mbpd crude on capex of $50 billion (nominal); in 2012, they produced 14 mbpd on capex of $262 bn (nominal). That’s a deadweight loss (is that the right expression in this case?) approaching $200 bn (in current dollars) per year for just eleven companies!
For that analysis, you can chain weight it, do nominal on nominal, ignore inflation entirely if you like. The result will be the same: The productivity of capital in the upstream sector has seen a catastrophic collapse in the last decade.
Baffling and Joseph,
I am 28 and healthy and do not want insurance. Last year I spent $181 on mesical care. Next year I will pay thousands of dollars forthe exact same physical. How am I not worse off. And there are millions of people like me, so yes it is a tax on the healthy.
Do you not understand that someone has to pay for healthcare? If the young and healthy aren’t than who is?
kopits,
I think perhaps you view government quite a bit differently from somebody like myself. government serves to improve the life of its citizens in ways the private sector cannot. specifically in areas where there is no profit motive, or where it is difficult to define cost/benefit analysis. biomedical and scientific research are two areas which come to mind. private sector is great at finishing the final 20% of research which results in commercialization-but they are terrible at defining and conducting basic science research-cost/benefit analysis is nearly impossible to conduct at this stage. so yes it is very difficult to quantify. but I also think it is very apparent the fruits of that research have created staggering advances in our standard of living over the past half century. where would we be if government hadn’t footed that research bill? who would have trained all those scientists and engineers who eventually commercialized that research? I think your approach to measuring the value of government spending would most likely result in a significant decrease in the quantity and quality of research to advance our quality of life into the future.
Baffs –
FY 2013 Fed R&D spending was around $141 bn, of which about $71 bn was Defense.
Now what do you suppose, if we’re looking for a correlation for defense spending, is the primary determinant of this year’s spend? (Hint: Think t-1.)
Do I think we’re getting $70 bn of life-affirming R&D out of defense? No, I think there’s a budget protected by highly entrenched interests in government, the Pentagon, and the big defense contractors, who are really outstanding at rent-seeking.
Again, with an FAA, at a minimum, Congressmen would have an incentive to i) minimize defense spending and ii) insure such spending as occurs is well-targeted. Do I believe that’s the case today?
Well, no.
anonymous,
then by all means pay the much lower penalty and continue to go without health insurance. although you do realize, while going without health insurance in the past all you were doing was passing your risk onto other taxpayers and relying on the fact a hospital could not turn you away in an emergency-very irresponsible behavior. but there have been several individuals on this blog recently who went at length to show how much you can save by skipping on the insurance and paying the penalty. in fact they were basically encouraging people like you to go without the insurance. have at it if you like, but please do not show up at an emergency room if a significant event happens-just stay in your bed and hope for a conservative miracle recovery. it is still your CHOICE to go without the insurance, and the penalty is not that great.
Anonymous You won’t be 28 and healthy forever. Obamacare effectively smooths healthcare costs over one’s lifetime. The young pay more than they should as long as they’re young, but they receive more when they are older. In the aggregate Obamacare will tend to reduce healthcare costs overall. Remember, when the GOP wanted to abolish Obamacare they found that they had to find other monies to pay for its abolition.
Stephen Kopits It is difficult to estimate the value of government services, but there are techniques that give us some idea. For example, in my office we develop many of the models that find the “shadow prices” lurking behind many weapon system acquisition decisions. It’s the typical tools…Lagrange models, bordered Hessians, etc. I won’t try to convince you that the political leadership understands how those models work (we usually dummy down the Powerpoint slides to give some fuzzy intuitions), but I think it would be too cynical to think that government bureaucrats make no effort to define costs and benefits absent a market.
kopits,
I don’t disagree with you on a fundamental level-I do not like waste either. although I would bet you find more waste in the pentagon’s non R&D budget than in their research agenda. there is actually quite a bit of dual use research-military and civilian benefit-often mandated by the DOD. it is simply that most research cannot be easily quantified as success/failure and cost/benefit, so decision making can be very difficult. in addition, R&D centers need stable and continuous funds to be productive. you cannot outsource and contract basic R&D, the inefficiencies would be extremely destructive on personnel and equipment. the yearly threat of a fluctuating budget is extremely unproductive for research labs.
“That’s a deadweight loss (is that the right expression in this case?) approaching $200 bn (in current dollars) per year for just eleven companies!”
It could also be a sign of many years of under-investment and now they’re trying to play catch up.
Anonymous, at my firm you pay the same for health insurance if you are 28 or 58. If you decide to forego the insurance that’s fine too…but we don’t pay you any more money. So if you work for a company that provides health insurance as an employee benefit, you are already subsidizing old unhealthy employees or employees having babies or employees with sick kids or employees who lost the birth lottery and have congenital diseases.
Is this also a tax on the young and healthy? Of course it is…but you don’t notice it because you don’t see it. So very disingenuous to say only the ACA has this impact on you.
If we could disconnect health insurance from employment we could immediately raise everyone’s pay by thousands of dollars. Then you would be happy and the guy with the sick kid would be sad.
This was an interesting post and clearly presented. It really highlights that one must be clear about the goal of measurement in the first place. For example, say we have some shock that significantly impacts the nominal price of equipment (same equipment falling in price, say). And, as a result, say that the resulting nominal share of equipment in fixed investment falls while in real terms it is steady. Which impact should the ratio measure? The answer goes to the point of measuring the ratio in the first place. It’s not obvious that one measure is superior. The economy in this example is consuming the same real values of equipment and fixed investment while paying less for the equipment component. Knowing the full story seems important for any policy maker, and that can’t captured with any of these two ratios alone.
Menzie addressed the point of why one should avoid ratios of real sector spending vs real GDP, but he hasn’t explained why he thinks the log ratio of federal real spending growth vs real GDP growth is important and informative.
If the simpler, easy to understand series, which here would be the ratio of nominal federal spending to nominal GDP, tells the story adequately, then it’s better to use that. If there’s a reason to use a far more obscure series such as log ratios of growth rates, then the derivation of the series and the reason why it’s important and informative should be fully explained.
Tom: In order to address the question of whether “enough” of some type of goods and services are being provided, one wants to know presumably the quantity provided. This is what a deflated series is supposed to measure. Some context in terms of overall size of (real) economy is useful, then. These provide the basis for the calculation adopted. I regret if this chain of logic was too complicated for you to imagine on your own. Clearly, I presumed too much.
As for Steve’s objection to the very concept of “real” federal spending, I have to disagree. Real GDP doesn’t measure some Platonic ideal of value, it measures what people pay, and then holds those prices constant over time. Government spending is just a kind of group purchase, undertaken on the general public’s behalf by elected officials and their staffs. There’s some inevitable compromise and waste involved, but maybe there could be less waste if Americans didn’t persistently re-elect Congressmen with ethics slightly better than Saul Goodman.
The real difficulty with measures of “real” GDP and other aggregates is that products aren’t stable over time. Consulting contracts are great example. Measuring them for nominal GDP is straightforward: how much they cost is how much they were worth. Measuring them for real GDP is very tricky: you need to compare them to consulting work done in the previous period and take a stand on whether this year’s consulting work was more or better or pricier than last period’s. That decision process is far more crude and arbitrary than most people realize. Thus “real” measures are inherently noisier than nominal measures. Thus when there’s not a specific reason to use real measures, nominal measures are better.
With federal spending, the share of nominal GDP is the first thing to look at. If the price trend for federal spending is different from the general price trend, that’s also interesting and potentially important, but be wary of estimation noise.
I haven’t looked at this blog in some time and I must admit that I was surprised to see Steven Kopits in the penalty box.
Steven is absolutely right that the previous post was needlessly confusing. I can’t see that this arcane academic justification for using a log transformation is worth losing most of the audience, especially when exactly the same point can be made without using the log.
Consider this post by Krugman earlier this year on the same topic. If you look at the first chart, Krugman graphs the ratio of federal spending to potential GDP to argue against the idea that spending under the Obama administration has been unusually high. If you look at Krugman’s chart, you can see that this ratio is now lower than it was in the mid-80s during the Reagan Administration. Krugman is able to make the same point, but without doing a log transformation, and without confusing his audience.
Whatever you think about his content, Krugman reaches a large audience because he never makes things more complicated than they need to be and he never singles out and insults his commenters, especially those who are saying that they don’t understand the presentation. That’s because Krugman wants to have a real world impact.
That’s the perspective Steven is coming from too–the real world in which clients who pay for content don’t tolerate high-handed obfuscation. Undergraduate students, there is indeed a lesson here. Listen to Steven. Your professor’s advice may be important to follow on the midterm, but when you get out of academia, you should ignore Steven’s point only if you want to commit career suicide.
Rick Stryker First, welcome back. The Krugman chart compared nominal federal spending to nominal Potential GDP. Menzie was comparing real spending to his best guess of real potential GDP. Krugman used nominal dollars because he was simply trying to make the point that you have to put the amount of spending in the context of the business cycle, demographics, etc. Menzie used the log ratios because he was arguing against the conservative line about the rate of government spending as a percent of GDP growing faster under Obama. Put another way, Krugman was showing that the level of nominal government spending as a percent of nominal GDP is not unusually high under Obama. Menzie’s chart shows that the growth rate of government spending as a percent of real GDP is not at all the out-of-control monster that American’s For Prosperity would have you believe.
Steven Kopits brought up the problem of defense spending. We see the same problem of substitution bias when comparing spending growth rates across weapon systems. Are you increasing spending on the Apache AH-64E relative to the AH-64D after allowing for substituting fewer AH-64E variants in squadron to accomplish a broader range of mission profiles? You could ask a similar question regarding the Abrams M1A1 versus the M1A2 tanks. You could also use log ratios to test Steven Kopits’ claim that government spending on this year’s program is simply some braindead calculation of taking spending at t-1 and adding an across-the-board adjustment. If that were true, then Menzie’s chart would be a flat line. The fact that the components grow at rates that differ from the aggregate is evidence that Steven Kopits’ understanding of government budgets is incomplete.
kopits
“I’m under a university plan. We have seen material increases in our health premiums due to internal NJ issues, not Obamacare. But let’s wait and see what’s the effect when Obamacare gets to this level.”
I couldn’t agree more! My gripe is with the folks over the past few years who have stated as FACT the increase incurred from the ACA, when 1) they were not materially impacted by the program themselves and 2) the alleged increases could not have actually occurred because the law was not even in effect. it is the disingenuous people with an agenda trying to kill the law by overtly stating as fact today some supposed increase tomorrow that is absurd! as you say, let’s see the results before we pass judgement.
rick stryker,
i would imagine menzie sounds off after continuously hearing how academics are a bunch of quacks who know nothing of the real world, and how real world economists are superior. these snide remarks appear in the blog all the time. his point is, there do exist times when you simply cannot use a simple or amateurish approach to solve a problem-a proper methodology is required. is that methodology understood by all? probably not. but nevertheless in many cases it beats producing inaccurate results which somebody may carelessly reproduce in the future, and draw faulty conclusions from. i do believe this blog is focused a bit more on those with some economics background and interest, rather than other blogs with a larger general readership. take the opportunity to learn from these issues rather than complain.
Lots of interesting comments.
For Rick and Baffs –
I have no particular problem being in the “penalty box”. I consider blogging and commenting a contact sport. If you’re going to blog and allow comments, then you’ll be both taking and getting hits. It comes with the territory. And that includes me just as anyone else.
Moreover, I actually think Menzie has some interesting points here. His link to chain weighting is both short and worthwhile, and I encourage you to take a look. Personally, I learned something about chain weighting that I didn’t know, and that’s a reason I come here. To learn, as well as to debate.
Rick Stryker: Thank you for advice on how to compose blog posts. I will pay careful heed, order to ensure that Econbrowser gains as large an audience as your blog has (!!!!). Seriously, do you think I aim to have as large an audience as Paul Krugman does? If so, I would not write out error correction models, refer to RMSEs, locally weighted regression results, Markov switching model results, cointegration test results, etc. I’m aiming at a more select audience, and really don’t care to influence a person who has no interest in learning, and in particular has an anti-intellectual worldview that holds that if one learns that dividing a chain weighted index by chain weighted index yields a meaningless result, will cover his/her ears and say “nyah nyah”.
Please feel free to revert to your previous avoidance of this blog.
kopits, that is why, while i may disagree quite often with your comments, we both continue to follow this blog! we continue to learn.
Now, let me comment on the weaknesses I perceive in using chain weighting.
First of all, nominal on nominal vales assume that their real components are rising at a similar rate. Thus, if GDP is 1000 and Fed consumption 100 for a given year, then we can say the ratio is 10%. If in the following year GDP is 1200 and Fed cons 120, then again the ratio is 10%. Thus, this implicitly sets the ratio of weights to 1, that is, it assume that “real” Fed consumption is growing in line with “real” GDP. This is the “naïve” view, but it has some considerable strengths.
1. The numbers are publicly available and they’re easy to calculate.
2. It’s easy to interpret. It’s important to keep in mind that readers will use their own knowledge to augment what’s on a chart. Thus, if Fed spending is 24% of GDP, I know without having to check that that’s a high ratio, and that 18% is a historical low in the last 40 years. That’s not on the chart, but I do have those numbers in my head. Thus, if I see a “Pct of GDP” chart, then I can add to it information I already know.
By contrast, I have no idea what Menzie’s scale was or how to interpret it. As a practical matter, I converted back to Pct of GDP in my head, because I simply have no idea how to interpret a -1.8 log value, and how it relates to a, say, -1.7 log value.
3. I understand the methodology used.
Nominal on nominal dollars figures can be manipulated, but they should even out over, say, anything three year period. By contrast, chain weighting is something of a black box, so I can’t easily tell how much and how the numbers have been massaged. For example, an F18 aircraft costs around $40 million; an F22 costs $150 mn (or maybe twice that, depending on how you count). A drone costs $18 mn. Now, an F22 can kill more than four F18s in a missile fight. It’s about even in a dogfight. We don’t use F22s very often. But we use drones a lot, and kill a lot of people with them, day in, day out. Question: Was the F22 an increase or decrease in “real” Fed consumption versus the F18? Compared to a drone? What about the $400 bn F35 project? Many believe such spending is both highly inefficient and ineffective. “The system is totally broken and everybody knows it,” said Sherman Mullin, retired former Lockheed F-22 program chief, in an LA Times quote. And defense programs are big money items in Federal consumption. Do I believe that the chain weighters have any clear idea how to value these elements? No. They can value the inputs: manhours, materials, computer time. Valuing the outputs is devilishly tricky.
4. It doesn’t assume the primacy of economics in decision making
I assume that, except when forced by events, government spending decisions are political, not economic. They are intended to curry favor with political constituencies. This implies that a cost-based approach is the right one. It’s about how many goodies you can give out; not how many you can produce.
Chain-weighting gives, I believe, the false impression that government spending is somehow made in the interest of GDP growth. I see precious little to make me believe this, whether in the US or elsewhere.
6. It’s not manipulated (Part 1)
Not only is chain weighting methodology a black box, so are the motivations of those conducting the weighting. Personally, I think I could drive a truck through the chain weighting system. How do I measure the productivity of consultants, for example? Are they more productive because they use computers and have iPhones? Because more of them have college degrees? Because the report page count is going up per real dollar? Because our bureaucracy is asking the consultants more trenchant questions? There’s potentially a large amount of subjectivity in this process.
7. It’s not manipulated (Part 2)
And then there’s the question of what Menzie’s actually trying to show on his chart. Is it intended to illuminate, or obfuscate? I can’t tell. I can’t easily see behind the curtain.
8. Does it matter for decision-making purposes?
Finally, there’s a question of whether a given approach influences your ultimate decision. If I used chain-weighting versus nominal values, would the interpretation be different? Would it prompt a different action?
We were working on a presentation yesterday, and my analyst came in with a sentence that said, “revenues of [company x] were $4.103 bn” I asked her, would the client’s opinion change if we said “$4.1 bn”? What about “$4 bn”? In fact, $4 bn is fine in this case; it’s less work for our client to interpret for his purposes.
So we can get very snazzy with chain weighting, and there are occasions when it’s necessary to use tools like that.
However, chain weighting can give the impression of great precision when in fact it may have relatively poor accuracy, and may sacrifice transparency and simplicity without leading to a different ultimate decision.
Side note: we’re in a group plan. Massive subsidy / transfer provided by the younger, healthier members because we all pay the same individual or family rates. The idea this is “new” in insurance is beyond idiotic: all group policies transfer from the healthy to the sick, from the young to the whatever. This is the entire basis of insurance.
When I was much younger, I spent some time with a friend who was an underwriter at Lloyd’s. He’d take around a sheet of paper – not kidding, an actual sheet of paper – and would convince various underwriters to sign their names to a percentage of the risk. Not big percentages, mind you. Many were under a percent. The top of the sheet had a bare description of the risk – like a particular ship voyage – and they’d literally tack on more paper to the end of the sheet to get enough room for it all to equal 100%.
Each underwriter represented a pool of money – many “names” with exposure to absolutely unlimited loss. They’d bet so much here and so much there, figuring out what they could afford to lose, what they would get paid as revenue, etc. That kind of thing used to be done by hand and now it’s done by computer, but it all involves shifting loss around from the “healthy” to the “sick”.
If a person can’t get this, there really is little hope for humanity.
Kevin –
Now this is actually an important point.
If you listen to the likes of Tom Eizember or Eirik Waerme, respectively the chief economists of ExxonMobil and Statoil, you will hear them say exactly what you did, that there have been “many years of under-investment” and now they’re trying to play catch up.
The statistics do not bear this out.
From 1998-2005 (seven years), total upstream investment was $1.5 trn (nominal) and crude oil production increased by 8.6 mbpd. From 2005-2012 (seven years), upstream investment was $3.5 trillion, and liquids (including some non-crude petroleum liquids) increased by 4.1 mbpd. Of this, virtually all of it was US and Canadian unconventional production. The legacy system of crude production which existed in 2005 (including all of OPEC, Brazil, US and Canadian conventional, deepwater, etc.) actually fell by 1 mbpd, despite approximately $2.5 trillion in upstream spend on this sector. And even today, this legacy segment represents 94% of total crude production.
Similary, from 1979-1983, crude oil production capacity–in a period of only four years–increased by 7 mbpd (and consumption fell by 6 mbpd). Thus, it cannot be argued that somehow 8 years are needed historically for supply to catch up with demand.
The data is very clear. The legacy oil system peaked in 2005, just as Ken Deffeyes (Prof. em. of Geology at Princeton) said it would. All the growth of supply since then has been either i) North American unconventionals or ii) natural gas liquids (from natural gas, not oil, production).
It’s not a question of either under-investment or an insufficient lapse of time. The investment has been massive, and eight years is more than adequate to bring supply on line.
Moreover, all the oil majors, with the exception of Exxon (and maybe Statoil) are cutting capex next year (as I said they would). Not only is investment not catching up, but at the majors, it’s already peaked.
The issue is fundamental. For those areas with traditional access, the easy oil is gone. We’re dependent on shale oil now, primarily. We don’t know how far that will take us.
There are some potential growth areas which have been less accessible in recent years: Mexico, maybe some Russia, maybe Venezuela (post Maduro), maybe parts of OPEC. This may help some, but I wouldn’t expect these collectively to be able to match recent US production growth rates, which have been well in excess of 1 mbpd / year.
Steven Kopits: You have laid out an indictment of measurement of real magnitudes, whether using chain weighting or fixed weight deflators.
Better beware the CPI…never mind the PCE. Never retreat! Never deflate!
Baffling said, “government serves to improve the life of its citizens in ways the private sector cannot.”
Actually a big portion of what government does these days is the gifting of taxpayer funded favors to politically connected cronies .
Max Baucus rewards ex-staffers with tax breaks for their clients
2slugbaits,
Thanks for the welcome.
I do understand what Menzie was trying to do and why he did it. I was merely pointing out that Krugman accomplished the same thing with a more straightforward presentation. The fact that Menzie had to devote a completely new post to explaining the first post shows, I think, that the first post was less than effective.
Stryker, Dr Krugman can be very heavy handed with his opponents.
Kopits, I enjoy reading your comments..
Professor Chinn and Professor Hamilton, this a most important economic website. We should all be thankful for your tireless work, even the bottom of the class.
Rick Stryker: I wrote the post as an exposition for my students. We have no idea whether people besides Steven Kopits were confused; and in any case, anybody who was confused is not in my target audience (maybe they are in yours?).
http://www.mygovcost.org/2013/08/31/todays-total-public-spending-entire-1961-u-s-economy/
I can tell you unequivocally, that since 1900 per capita sending has simply exploded..
If the theme of this thread is to the contrary, then it is plainly incorrect.
http://www.usgovernmentspending.com/breakdown_1970USdt_15ds5n
The per capita spending in 1970 was $16oo..In 2010, it was $19,ooo. Adjust 1970 by 7x and you get per capita spending of $11,ooo.
All numbers rounded out…
Menzie is more unbiased than Krugman, Krugman is fully bought.
“Jocky of Norfolk, be not too bold,
For Diccon, thy master, is bought and sold.”
Shakespeare: Richard III., act v, 3.
James is a bit drifting to the right since his Harvard ambitions, or it could be I am wrong with that- in case, sorry to you JDH.
Anyway, reading the 1922 Irving-Fisher formula again was really nice.
Whoa there, Menzie.
You, not I, posted on the limitations and considerations of chain weighting. You opened the door, I just drove through it.
The purpose of my comments were two-fold. First, I wanted to bring the readers’ attention to more practical considerations when deciding how to present data. We deal with this all the time in our work. I do use chain-weighting and deflators, but I’ll be more careful with them in the future based on your post–which I took to be a constructive one.
Second, I wanted to examine my own prejudices a bit. I think we can often form opinions without conscious thought. A silly example: In my mind, I always thought you could go with the kids to Toys-R-Us until the grew up, that is, until they went to college. Now, of course, that’s absurd–they’re done with Toys-R-Us at the age of ten. But somehow, I’d never really thought about it at all, and I’d formed a subconscious expectation. I wanted to think a bit about my own view of government consumption.
As you’re well aware, I’m inherently biased against government spending, as I have made my living from it for a number of years in various countries. Government is a cost, not a profit, center. And therefore applying profit center metrics (ie cost/benefit) are often pointless. It just doesn’t work that way. In any event, I wanted to think some of these issues through for myself, and the comment was just a means to do that.
So, I’m not against deflators. I use them frequently. But I thought your chart unnecessarily arcane, and I wanted to highlight some considerations for you, myself and the readers when thinking about how to present these things, both related strictly to the chart itself and more broadly on its impact on the reader and decision-making.
Steven Kopits: The issue is that the point you made about real vs. nominal is one that applies not to chain-weighting per se, but rather the calculation of real variables (productivity calculations for instance are everywhere; and non-market mediated prices are everwhere regardless of deflation). Well, that’s fine as long as people understand that you are making a general indictment about deflation into real quantities.
You then proceed to argue that the use of chain weighting (actually deflating into real values) is a political process. Here I think you are veering into black helicopter Jack Welch territory, and people should understand that as well.
As for the expositional aspects, the point is taken that people such as yourself might find it confusing. As I’ve said, that’s neither here nor there for me.
This maybe of some helf to others…
http://www-personal.umich.edu/~dagrawal/100B_files/Review%20of%20Chain%20Weighted%20GDP.pdf
Please post this, if you think it has any valve; if not just discard..
http://www.tsptalk.com/mb/economy/3859-chain-weighted-cpi-defined.html
Menzie,
Thanks for clarifying. I thought your goal is similar to other economics bloggers, which is to get a wide readership and be influential. But instead your attitude is that you are only writing for a small group of professional macroeconomists and a few students. So what if people don’t understand a chart. That’s their problem. You’re not talking to them anyway.
So it’s the opposite of Krugman’s strategy. Krugman is trying to maximize his readership because he wants the ideas he supports to be widely understood and implemented in policy. You on the other hand are trying to minimize your readership.
I think we have finally found some agreement. I support your goal to minimize your readership, since I for one would rather not have Keynesian economics and other left wing fallacies and propaganda widely disseminated. By the way, your strategy of insulting commenters also works well to minimize your readership. So, I guess I support that policy and if readers such as Steven Kopits and Rick Stryker have to suffer, I need to remember that it’s for a greater good.
Since you did write this post for students, I thought it would be a good idea to give them a more complete answer, especially if they might be more concerned than you are with influencing their audience. Your post explained what chain weighting is and why the sum of the parts of real GDP don’t equal the whole. But you didn’t answer the question of how much it matters. Instead, you just assumed that it mattered enough to justify taking logs.
In these sorts of questions we need to look at data of course. Let’s go over to the 2009 chain-weighted Real GDP data available at the BEA here. You students can follow Professor Rick by doing this: click “interactive data” then “GDP and Personal Income” then “Begin Using Data.” Click the plus sign on Section 1 “Domestic Product and Income” and then open Table 1.1.6, which is real GDP. Now go to “Options” and change the first date to 1967 (which appears to be where Menzie’s data starts) and choose “quarterly.” Then push “update.”
You should now have a quarterly data set of real GDP with all the components from 1967 to the present. If you scroll down to the bottom, you can see the residual. Let’s take 1967 Q1 for example.
Y = C + I + G+ EX – IM + residual
From the table,
Y = 4320.9
C = 2549
I = 561.2
EX = 150.7
IM = 197.9
Thus, the residual should be Y – C -I – G -EX +IM
= -171.9
But that’s the entry in the residual cell, which we’ve just verified. Thus, the individual components of the chain weighted index are too big, as expected.
Now, we can divided the residual by real GDP to see its magnitude. For 1967 Q1, that’s 171.9/4320.9 = 4% of GDP, which is quite large. On the other hand, if we go over to the current data and do the same division, we can see that the residual is very small, which we expect, since if we are close to the base year of 2009 we should have very small residuals.
Now, we are interested in comparing the 1980s to the current data. Residuals are very small currently but what about the 1980s? In 1986Q3, the residual is 1.88% of GDP, which is quite large. But we have to remember that we are only interested in one piece of GDP, namely federal spending to which we will add transfers. How big is the residual component of just that federal spending piece?
You can get an idea by seeing how big federal spending is as a fraction of C + I + G + EX – IM + residual, since federal spending is broken out starting with 199Q1. We see that federal spending is between about 32.5% and 41.5% of total G. We only have total G for 1986Q3, but we could assume that federal spending is 35% ( a middle estimate) of G to approximate the federal component, or .35 X 2043.4 = 715.2 The proportion of federal spending to the total would be 715.2/(sum of components + residual) = 8.9%. It’s reasonable to suppose that the residual reflects the weights of the components so approximately the residual due to federal spending would be the total residual X component weight, or 8.9% X 1.88% = 0.17% of real GDP.
Is this small? Looking at Menzie’s chart, the log of the ratio during the 1980s varies between -1.5 to -1.65. Exponentiating, we see that exp(-1.5) = 22.3% and exp(-1.65) = 19.2%. Taken as a ratio, that means the spending varied between 22.3% and 19.2% of GDP.
Since the error from the federal spending component is on the order of 0.17% of GDP, which is small, you could just take a straight ratio of spending to GDP and interpret the graph in the natural way. And you could always footnote the chart to say that there will be small errors when you far away from the 2009 period. That way you won’t have to use a confusing log transformation.
“2 Chain Weighted GDP
There is a problem, however, with calculating real GDP using the method outlined above. In particular, by holding
prices constant, it is ignoring the fact that some quantity changes might be due to substitution effects arising from
relative price changes as opposed to changes in productivity or efficiency. For example, suppose that we observe a
decrease in the quantity of cars sold in the U.S. This change could be due to (1) decreased efficiency in domestic auto
manufacturing or (2) an increase in auto prices relative to, say, public transportation. Again, as macroeconomists, we
are concerned primarily with issues of productivity, not price/substitution effects. Not surprisingly, substitution bias
problem, may cause us to have a better or worse outlook on a country’s macroeconomic performance than is warranted.
Then challenge, then, is to incorporate some of the information prices and price changes have on spending
and production activities into GDP calculations. Up until the last ten years or so, this was accomplished by periodically
updating the base year to reflect this new information. This, however, introduced difficulties of its own. In particular,
1 The Bureau of Economic Analysis (BEA) is responsible for collecting, producing, and reporting GDP information for the United States. 2 Implicit price indexes are not to be confused with price indexes which measure P directly. The CPI, PPI, and import/export price indexes are
examples of such directly calculated estimates of aggregate prices used in the U.S.a base year revision induces changes all prior estimates ofreal GDP and more importantly growth therein. In essence,
then, updating a base year is rewriting history. Such revisions—particularly to growth rates—could substantially alter
one’s reading of economic performance: economists consider a 2% annualized growth rate in real GDP as sluggish,
for example, while a 3.5% growth rate is considered healthy, and a 5% rate is extremely rapid.
A technique called chain weighting largely overcomes this difficulty. In essence, chain weighting, continually
updates the base year by introducing new price information into the GDP calculation; this technique was adopted as
the standard way to measure real GDP in the U.S. in 1996. Here is a rough example of how it works: first, one would
estimate real GDP for some base year in the usual fashion:”
I did not know that economists are also measuring productivity, with the GNP…
“Definition of ‘Chain-Weighted CPI’
An alternative measurement for the Consumer Price Index (CPI) that considers product substitutions made by consumers and other changes in their spending habits. The chain-weighted CPI is therefore considered to be a more accurate inflation gauge than the traditional fixed-weighted CPI, because rather than merely measuring periodic changes in the price of a fixed basket of goods, it accounts for the fact that consumers’ purchasing decisions change along with changes in prices. Because the fixed-weighted CPI may consistently overstate inflation by ignoring the disinflationary effect of quality improvements and new technology, in addition to the substitution effect, the U.S. Bureau of Labor Statistics maintains that the chain-weighted CPI is a closer approximation to a cost-of-living index than other CPI measures.”
I am beginning to see the light! Now the question is, how much more accurate is this new method?
Thank you for any replies!
BEA’s Chaining Expo:
http://bea.gov/scb/account_articles/national/0597od/maintext.htm
Menzie –
You have to decide how you want to present your chart. Whether a methodology is good or bad is purely a function of the author’s intent. You’re the ultimate judge of that.
As for generalizing my indictments: For transactions lacking a market test, yes, I believe using deflators is not necessarily political (they could be), but they are certainly subjective. These are different things. I’ve argued the treatment of asset retirement obligations with auditors from KPMG, for example. That wasn’t a political argument, it was about whether the attempt at greater “objectivity” didn’t actually introduce greater subjectivity and make accounts actually less transparent to investors.
The issue is similar with chain-weighting. You give me ten minutes with the guys deflating defense spending, and I’ll take apart their foundations. But this is not a surprise, and I doubt they would contest my concerns. If they want to deflate, they have to make certain decisions and act on certain assumptions, which they themselves understand as subject to material limitations. But that’s real world.
For the chart you presented, for my taste, I prefer nominal on nominal to a deflator, for the many reasons I stated above.
“By rights, your health plan should show what portion covers you actuarially, and what portion represents the “tax” that Justice Kennedy tells us it is; and that tax should be shown in government accounts.”
Not directly relevant to the point being made there, but I’d just point out that it was Justice Roberts, not Kennedy who wrote the majority opinion on ObamaCare. Roberts identified as a “tax”, not the subsidies inherent in the cross-subsidization of insureds, but the nature of the “penalty” that is imposed for failing to adhere to the mandate.
Kennedy was among the four dissenters who specifically argued the penalty was, well, a penalty.
While Kopits may well be right that these enforced subsidies are in essence a “tax” that was not really on the radar at the time and it was not the basis of the opinion written by Roberts. Part of the reason for that is that the regs had not been written and the pricing worked out. It was really only after the opinion was rendered and the regulations under ObamaCare were written, the exchanges developed and the pricing policies worked out, that the extent of this subsidization (or”tax” if you will) became readily apparent and started to be discussed in public.
Hear is Professor’s Von-Der-Lippe 109 page dissertation on Chain Weighting. I had no idea, that man’s thinking was so advanced…
I am sure Professor Chinn is familiar with it but I wonder about the BEA…
http://von-der-lippe.org/dokumente/EZB-Chain-1.pdf
Understanding Chaining for Dummies…
http://blogs.reuters.com/edgy-optimist/2012/12/20/whos-afraid-of-chained-cpi/
Hans If you want to get into this stuff a little deeper, a good place to start is with the Centre for Efficiency and Productivity Analysis (CEPA) at the University of Queensland in Australia.
http://www.uq.edu.au/economics/cepa/index.php
In addition to lots of working papers freely available on line, they also have an excellent (and highly readable) primer book that discusses many different price and product indices (Paasche, Lasperyres, Fisher, Tornqvist, Malmquist, etc.:
http://www.amazon.com/Introduction-Efficiency-Productivity-Analysis/dp/038724266X/ref=sr_1_22?s=books&ie=UTF8&qid=1387144273&sr=1-22&keywords=knox+lovell
I use many of their books and software when working with indices, productivity analysis and stochastic frontier models and data envelopment.
Chain weighting to account for the substitution effect is one of the many ways in which statistics are astutely massaged; using it for deflating nominal GDP makes “real” GDP look significantly bigger.
It is the usual story: if average consumers eat more cheap beans because they can no longer afford to buy expensive sausages, this results in a higher “real” GDP.
Rick Stryker: I merely answered Steven Kopits question. That doesn’t strike me as an insult; he didn’t seem to take it as one. And I am not sure when in a post I have insulted you. If I have, I apologize. I do recall repeating your defense of the Romney assertion that 500,000 was an ordinary pace of job creation in a recovery. But I don’t recall calling you an idiot, or something of that nature.
But please, please, please, do help me in my endeavors to target the audience I wish to by hewing to your previous inclination not to visit this blog.
Nominal GDP (price x quantity) can be observed, most likely with error. Aggregation of nominal GDP is straightforward. If we are fortunate, most of the large errors will cancel in the aggregate.
“Real” GDP is a theoretical construct that cannot be observed because quantities cannot be aggregated. For example, it is difficult to add tons of steel to number of haircuts. Prices are the common factor that allow aggregation.
If relative prices never change, then any year’s prices will work for aggregation. When relative prices change, and substitution occurs, then the prices used for aggregation from an earlier base year are no longer relevant.
Quantities that have grown more slowly due to relatively faster price growth will have too low a (base year) price weight, and quantities that have grown more quickly due to relatively slower price growth will have too large a (base year) price weight. As a result, real growth after the base year will be understated. Chaining allows the base year to be updated continuously and thereby minimizes the substitution bias in aggregate “real” GDP.
Thank you for the suggestion, Sir Slugbaits…I will examine your link, but this maybe taxing my capacities.
I could only comprehend about 1% of this material:http://von-der-lippe.org/dokumente/EZB-Chain-1.pdf
A very good rebuttal to Professor Chinn, Mr Kopits..
If any of this chaining involves subjective quantifying then you have lost my support…I believe subjective analyzing is already being used in the current CPI…
This maybe of some interest as well..
http://www.richmondfed.org/publications/research/special_reports/macroeconomic_data/pdf/macroecon_price_indexes.pdf
We must all agree, that this type of index tracking is very tricky business, even for the authors and will never provide any form of 100% accuracy…
Does anyone have an extra bottle of Bayer?
One should not forget the importance of chained CPI and its interpretation in light of its new use in evaluating social security benefits going forward. These discussions we are having do have real world implications.
Menzie,
So you are not sure when in a post you have insulted me? Really? How about the time you called me a “crazy” with “reprehensible” views that should be “pitied” while lamenting the fact that the technology won’t enable you to censor me?
You say that your target audience are those that didn’t need your spending/GDP chart explained to them. But I’m your target audience. I’m fully aware of how chain weighting works and in fact just made a substantive comment to argue that quantitatively the error is small for the ratio you took. But, in typical fashion, you ignored that.
Why don’t you just admit that your target audience is the set of all people who do not effectively and vigorously defend conservative free market principles?
I know that commenting on this blog doesn’t really accomplish anything. Plus I’m much too busy too comment on this or any other blog. So you can rest easy that self interest will restrain me. You can confidently attack Ed Lazear, members of the Republican Party, and the Heritage Foundation without any challenge from me.
Rick Stryker: I said I didn’t insult you in any post; I may have in a comment. But I thought I characterized your views as crazy and reprehensible (they are); if I called you as a person specifically crazy and reprehensible, then I apologize. My parents taught me better.
Correction:…Quantities that have grown more slowly due to relatively faster price growth will have too low a (base year) price weight, and quantities that have grown more quickly due to relatively slower price growth will have too large a (base year) price weight. As a result, real growth after the base year will be overstated. Chaining allows the base year to be updated continuously and thereby minimizes the substitution bias in aggregate “real” GDP.
From what I can tell, the real expert on this subject is, Professor’s Von-Der-Lippe…
Has this topic been subject to a public debate?
And how much does chained indexing improve statistical reporting, over a decade?
Without an answer, chaining should be restricted to the academic textbooks or the Rocky Mountain regions..
rick stryker,
I would imagine you are not part of menzie’s target audience because he is interested in people who will look at the data presented and draw valid conclusions from it. this would involve possibly changing one’s view on a subject in light of new data. you tend to display a rigid ideological view of the world, and have already predetermined how it should operate. when the facts on the ground dispute this worldview, you simply choose to redefine reality rather than how you imagine the world to operate. an example would be the unemployment rate. I imagine you have the same perspective on proper policy whether the unemployment rate is high or low, even when evidence suggests otherwise.
Menzie,
People who can’t back up their own claims resort to the charge that the views that they disagree with are “crazy” and “reprehensible.” You don’t see me doing that. I make serious arguments. I always link to evidence, whether it’s data as in my comment above, articles, research papers, or videos. I work out numerical examples to illustrate points.
Look at my comments on the Reinhart-Rogoff affair and the Deaton affair here and tell me how my views are crazy or reprehensible. Am I wrong in my analysis? Where do you disagree?
Like I said, I don’t have the time right now to comment much on anything. And I don’t have a lot of desire to comment on a blog where one of the hosts would like to censor views he disagrees with. But I won’t sit by and not comment on something I really disagree with if I have some free time to do so. I don’t think you can reasonably expect to put out highly politicized analysis on the internet and not be seriously challenged by someone from the other side. The internet lowers the barrier to publication substantially. But it also means that you are more readily subject to criticism. Sorry, but that’s just the way it is.
Rick Stryker: OK, I guess you’re not that busy. I didn’t say all your views are reprehensible (I didn’t comment on your R&R comments, for instance). However, I think this one policy recommendation in response to the massacre at Newtown is:
So, a proposal to make each school eine kleine Festung, nicht da? Why stop with a Glock 21? If my students can be armed, why can’t I have an AR15? Why not a SAW? And why just a few teachers, why not all of the teachers (although maybe we should check ’em in during faculty meetings).
So if you wonder why I wonder, well, that’s a exhibit 1.
Menzie,
You are taking one section from a long series of comments I made, comments that were filled with facts and details on just about every aspect of the gun control debate. Rather than go through them again, I’ll just note that the views I expressed in those comments have been validated by the most recent school shooting at Arapahoe High School that happened just a few days ago. Let’s see how my views stacked up.
Stryker Argument: Banning assault rifles will do nothing to stem school violence. Assault rifles are functionally equivalent to more mundane weapons and only differ cosmetically. School shooters can switch to different guns and often employ bombs and other weapons anyway.
Fact: School shooter Karl Pierson was armed with a pump action shotgun, used by hunters the world over, a machete, and three homemade molotov cocktails, one of which he detonated.
Stryker Argument: Limiting access to guns is often justified on the grounds that shooters are typically insane and so we need to keep guns away from them. While we do need to strengthen enforcement of laws to keep guns away from the mentally ill, shooters are often very rational and respond to incentives, especially armed resistance.
Fact: Karl Pierson does not seem to have been suffering from any mental illness. His motive seemed to be to exact revenge on his debate coach, who had kicked him off the team. Other students described Pierson as a committed Leftist. He mocked Republicans on his Facebook page, argued for greater gun control, and called himself a “Keynesian.” He intended to shoot the debate coach and likely many innocent students because he was angry.
Stryker Argument: The most important way to limit the damage from a school shooter is to confront him with armed resistance immediately. That’s why you need armed guards in schools as at Columbine or armed, trained, teachers if guards aren’t possible.
Fact: Arapahoe High School, like many other schools, has an armed deputy sheriff on regular duty at the high school. Once the shooting started, the armed guard immediately confronted Pierson. Pierson retreated and committed suicide. The whole incident was over in under 2 minutes. He never had a chance to use his remaining ammo, the machete, or the 2 bombs.
………………………………………….
The policy worked to contain the violence. I’d like to know how in the world you can claim that my view is “reprehensible.” If people listened to you, Menzie, likely a lot more kids would have died or been injured in the Arapahoe school shooting.
Rick Stryker: In Australia, a rigorous program of gun control has reduced mass killings substantially — well to zero. In contrast, your program would likely displace shootings to other “soft” targets. Then we would need to militarize the other places. Eventually, we would need to arm everybody everywhere. Perhaps that is your ideal, but it’s not mine.
In addition, we know that suicides are often undertaken with firearms — maybe like your Glock 21. So there would be spillover effects.
However, I still await your response to the “arms race” issue. Will we prohibit students from carrying guns, but allow teachers to carry guns, on campus? If we allows the students to carry guns, should I wear a flak jacket? And why shouldn’t I be able to carry a bigger gun than the students — say a SAW — never know when a gang of students will attack!
I will admit that if I pack a gun, and the student don’t, they might pay more attention in class. However, that is not the way I want to get better class participation.
Menzie,
I don’t think the facts are consistent with the claims you have made.
On Australia, it’s very difficult to say whether the gun ban after the Port Arthur massacre in Australia really has prevented any mass shootings. It’s true that none happened after the more stringent gun control was put in place. But mass shootings are very rare events. Below, I’ve tabulated all the mass shootings in both Australia and New Zealand since 1980.
Country Place Date No.Victims
Australia Port Arthur, TAS28 April, 1996 35
Australia Hillcrest, QLD 25 Jan, 1996 6
Australia Central Coast,NSW27 Oct, 1992 6
Australia Strathfield,NSW17 Aug, 1991 6
Australia Surry Hills,NSW30 Aug, 1990 5
Australia Rock Country,NT25 Sept, 1988 6
Australia Melbourne,VIC8 Dec, 1987 8
Australia Canley Vale,NSW10 Oct, 1987 5
Australia Melbourne,VIC9 Aug, 1987 7
Australia Pymble, NSW 23 Jan, 1987 4
Australia Wahroonga,NSW1 June, 1984 5
Australia Campsie, NSW 24 Sept, 1981 5
New Zealand Raurimu 8 Feb, 1997 6
New Zealand Dunedin 20 June, 1994 5
New Zealand Paerata (near Auckland)20 May, 1992 6
New Zealand Aramoana 13 Nov, 1990 13
As you can see, Australia had a small number of mass shootings in the 1980s and 1990s while New Zealand’s are confined to the 1990s. The theory that the more stringent gun control prevented mass shootings is based on the fact that semi-automatic rifles and shotguns as well as pump action shotguns were banned in Australia after Port Arthur. Supposedly, would-be shooters would lack the firepower to engage in mass shootings.
The problem with that belief is the New Zealand experience. New Zealand is very similar to Australia in a number of ways, including its gun laws. But New Zealand never banned semi-automatic rifles and shotguns or pump action shotguns. And yet New Zealand did not experience a mass shooting after 1997.
Moreover, if you look at the details of the New Zealand mass shootings, they are not consistent with the theory. The 1997 Raurimu mass shooting was done with a single shot shotgun, not banned in Australia. Also, the 1992 Paeratu mass shooting was done with a double barreled shotgun, not banned in Australia. These shooters were not supposed to have the firepower to do a mass shooting; but they did it anyway.
I also think the facts contradict your belief that allowing people to arm themselves will somehow turn into an arms race. Over the past 30 years, most states have become much less restrictive in allowing people to possess and carry firearms. Most states are now shall issue states–meaning that if you apply for a concealed carry permit, the authorities must give it to you unless you are in a category disallowed by law. 5 states allow concealed carry of a firearm without a permit. These states also allow open carry of a firearm along with many others.
The critics have consistently warned that as these less restrictive policies are adopted, they will lead to an arms race, with everyone arming themselves with progressively greater weaponry. Violence was supposed to skyrocket, as people had shootouts over traffic incidents. But none of that happened, not even remotely.
So, my response on the “arms race” issue is that we already know that won’t happen. We have 30 years of experience.
By the way, I wonder if you have noticed an arms race or outbreak of violence at the University of Wisconsin? Are you aware that Wisconsin became a shall issue state in 2011? (It’s also an open carry state.) The University of Wisconsin asked the state legislature to exempt colleges and universities from the new law, which the legislature did not do. Instead, there is a provision that allows Wisconsin universities to post signs, at least 5X7 inches, prominently at entrances to campus buildings that say weapons are not allowed. As long as a university building has the sign, you can’t bring a concealed handgun in, despite having a permit. However, students and others walking around the U Wisconsin campus can’t be prohibited from carrying a concealed handgun if they have a permit. Also, students and faculty can keep handguns in their cars in the parking garage if they want to and have the necessary permit.
You asked in your comment, “Will we prohibit students from carrying guns, but allow teachers to carry guns, on campus?” Menzie, I hate to break it to you, but students can already carry concealed guns on your campus. As an employee, on the other hand, you can be prohibited by the University from carrying a concealed handgun on campus, even if you have a permit. As I mentioned, the University can’t prohibit you from keeping a gun in your car, as long as you have a permit.
One other point on Australia. In my table, a mass shooting is defined as a shooting that resulted in at least 4 deaths. In evaluating the laws effectiveness in preventing mass shootings, it’s also important to look at near misses–events that might have turned in to mass shootings but for chance.
There are two near misses. The first was in 2002 at Monash University. Huan Xiang, apparently upset that he was going to fail his econometrics oral and also believing that another student was responsible for his failures, stormed in to the class with 5 handguns and started shooting. Although shot, the instructor and another student heroically tackled him, but not before Xiang killed 2 people and wounded 5. If the circumstances had been a little different, that could easily have met the definition of a mass shooting.
This shooting happened after all the more stringent gun control was put in place. Despite being an indigent student, Xiang had been able to legally acquire 7 handguns through a sport shooting association.
Another incident happened in 2007 in Melbourne’s central business district. Christopher Hudson, a Hell’s Angel motorcycle gang member, had been drugging and boozing all night. In the morning, Hudson assaulted a stripper and some bystanders, 2 men and a woman, tried to intervene. Hudson started shooting, killing 1 and wounding the others. Again, if circumstances had been a little different–more bystanders around, etc., this might have turned in to a mass shooting.
I don’t believe the evidence backs the claim that Australia’s laws have prevented mass shootings.
rick stryker:
“Stryker Argument: Banning assault rifles will do nothing to stem school violence. Assault rifles are functionally equivalent to more mundane weapons and only differ cosmetically. School shooters can switch to different guns and often employ bombs and other weapons anyway.
Fact: School shooter Karl Pierson was armed with a pump action shotgun, used by hunters the world over, a machete, and three homemade molotov cocktails, one of which he detonated.”
rick, you are changing the argument ever so slightly to your favor. the argument against banning automatic weapons is not the elimination of school violence. this of course is practically impossible-crazy people still exist and will continue to do evil. the argument against automatic assault weapons is that the magnitude of these events will be decreased. and your example is a case in point.
the shooter had a pump action shotgun, and only one fatality resulted. you seriously think only one fatality would have resulted with an automatic assault weapon? you cannot compare a 5 shell shotgun with an assault rifle and 50+ bullet easily reloadable ammo clips. that is the reality of this incident.