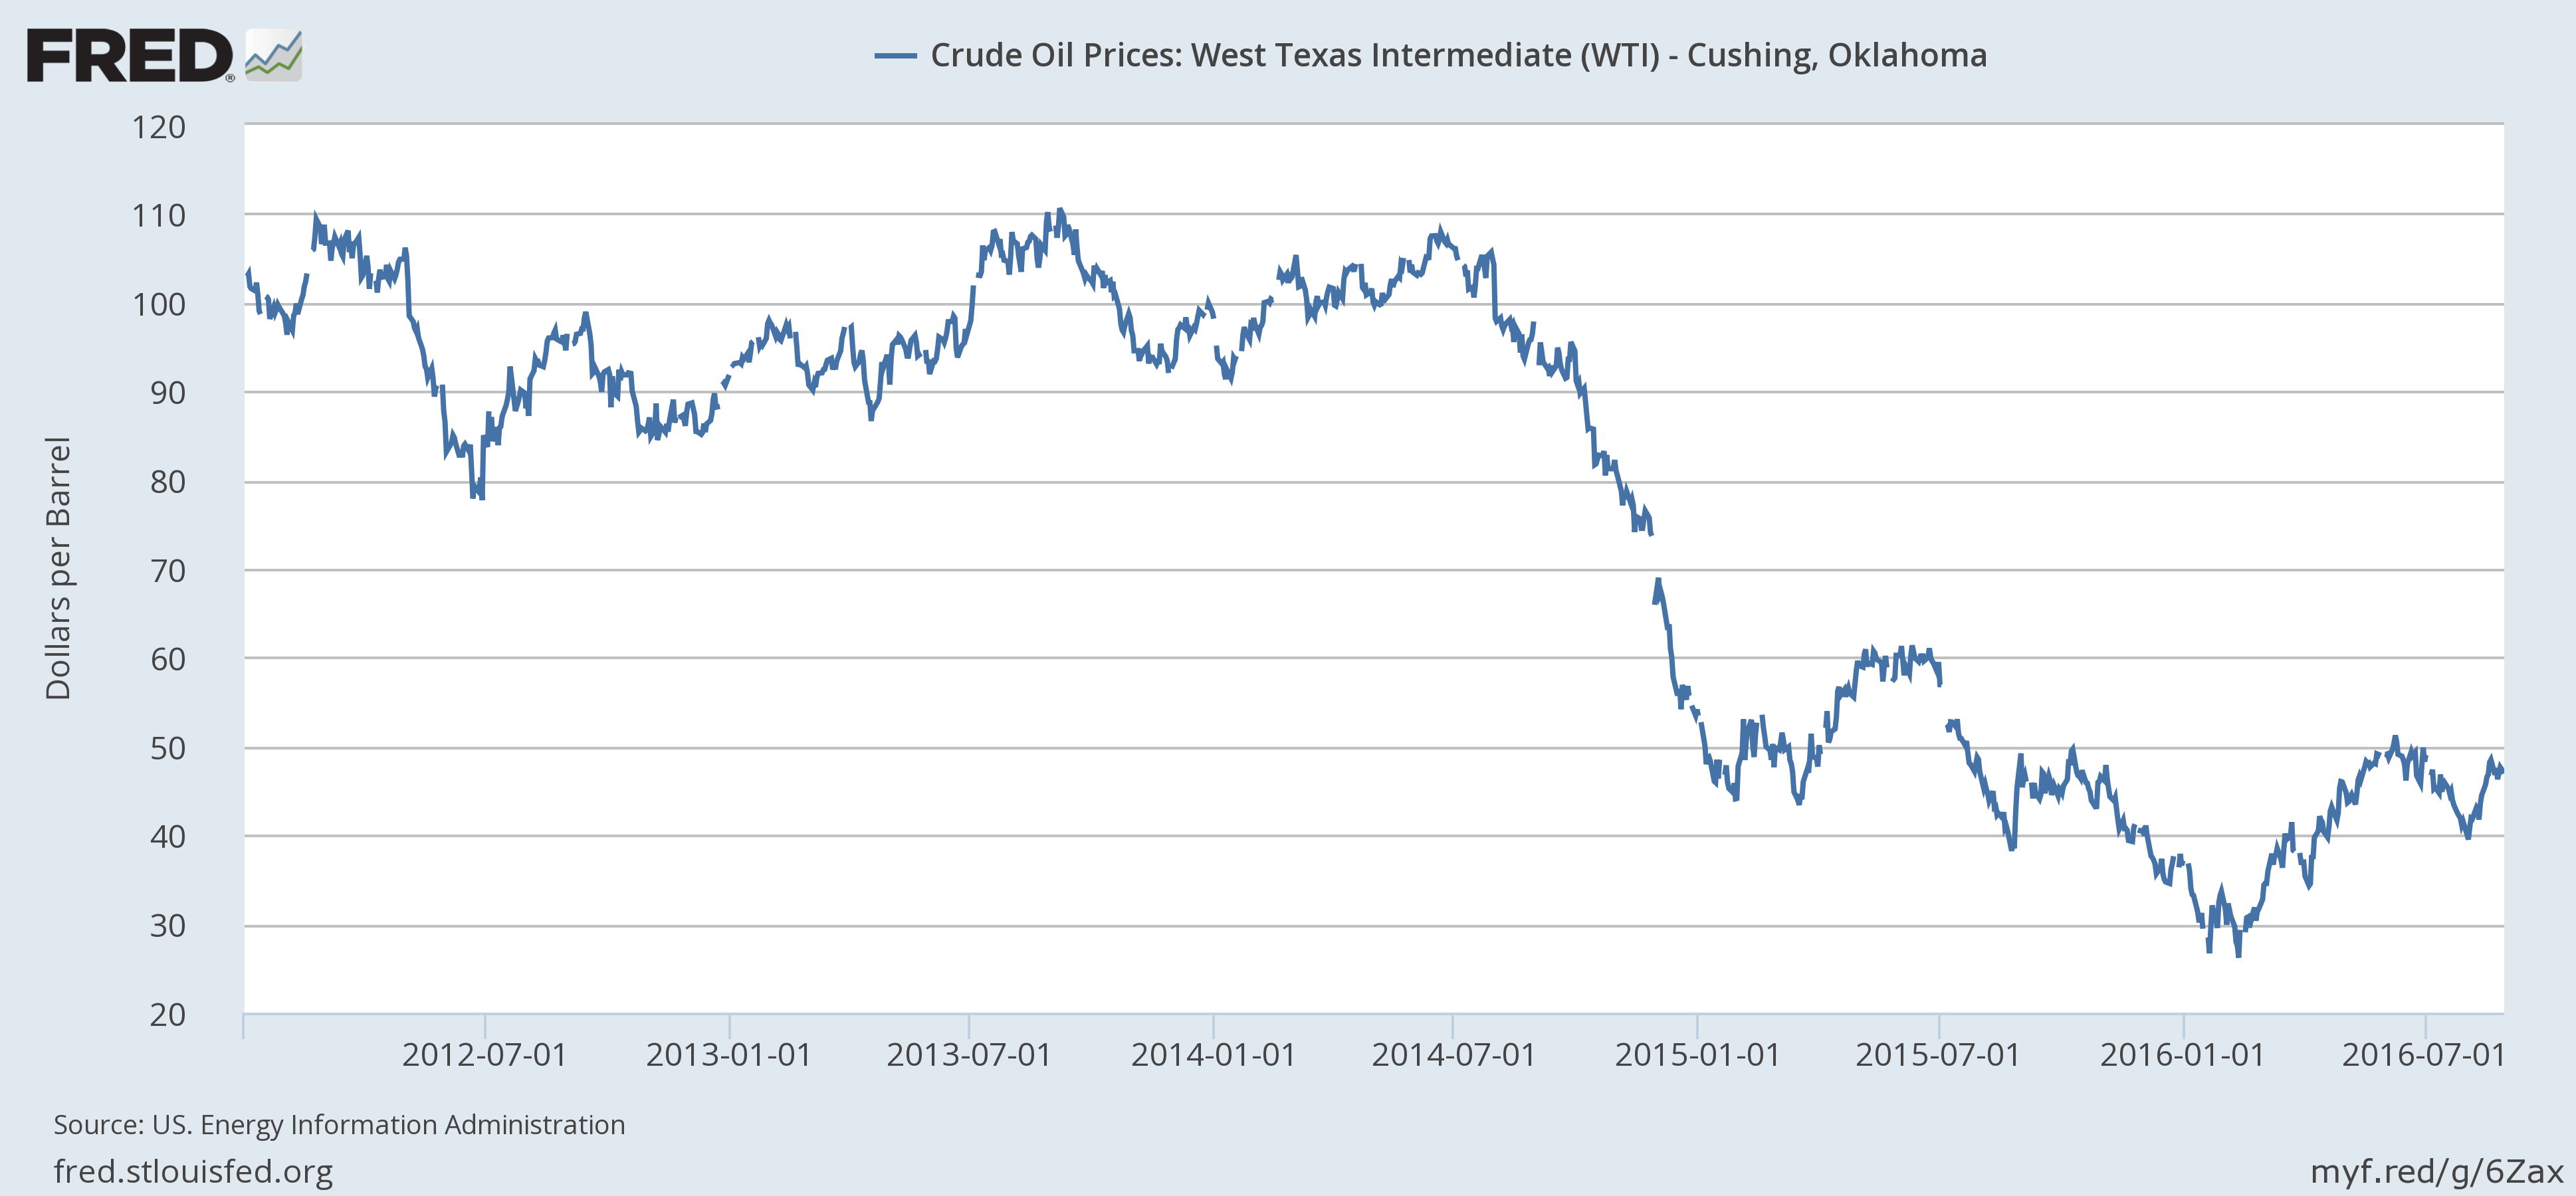
The price of crude oil has had some sharp swings over the last month. But the trend since January has clearly been up.
World oil production barely increased between 2005 and 2013, a period of strong oil demand from emerging economies. That combination supported an undulating price plateau around $100/barrel. The price ceiling was broken by a surge in world oil production beginning with prolific U.S. shale oil development.

World field production of crude oil, in thousands of barrels per day, monthly Jan 1973 to May 2016. Excludes natural gas liquids, biofuels, and refinery processing gain. Blue line segment connects June 2005 and June 2013. Data source: EIA Monthly Energy Review, Table 11.1b.
Global oil production was carried further upward by Iraq, where postwar investments started to yield results in 2014, and by the lifting of sanctions on Iran last winter. These two countries today are producing 2.2 mb/d more than they were at the start of 2013.

Iraqi field production of crude oil, in thousands of barrels per day, monthly Jan 1973 to May 2016. Data source: EIA Monthly Energy Review, Table 11.1a.

Iranian field production of crude oil, in thousands of barrels per day, monthly Jan 1973 to May 2016. Data source: EIA Monthly Energy Review, Table 11.1a.
But turmoil in Nigeria has brought that country’s production down by 700,000 b/d relative to where it had been at the start of 2015, and their problems may only get worse.

Nigerian field production of crude oil, in thousands of barrels per day, monthly Jan 1973 to May 2016. Data source: EIA Monthly Energy Review, Table 11.1a.
And the new U.S. fields that were the original source of the global production gains aren’t profitable at $40/barrel. U.S. production is now down 700,000 b/d from where it had been early in 2015. The net result is that despite the gains from Iraq and Iran, total world oil production this May was 700,000 b/d lower than it had been at the start of 2015.

U.S. field production of crude oil, in thousands of barrels per day, monthly Jan 1973 to May 2016. Data source: EIA Monthly Energy Review, Table 11.1b.
The price of West Texas intermediate is now at $45/barrel, up 20% from the start of the year. For several years now I’ve been using a simple statistical model to judge how much of a given move in oil prices might be attributable to demand factors. The model calculates how much of the change in the price of oil could be explained statistically by copper prices, the exchange rate, and nominal interest rates, the assumption being that movements in these variables are mostly driven by factors other than oil supply. When I updated that calculation using the latest data (as you can do yourself with the calculator here), I found that essentially all of the oil price increase during calendar year 2016 should be attributed to supply factors, and none to demand factors. Although the weakening of the dollar during this year would be consistent with rising oil prices, both copper prices and interest rates fell, which normally would be associated with lower oil prices. The result of the three factors together is a net wash, causing the model to conclude that changes on the demand side do not explain any of this year’s move in oil prices.
In other words, the forces of supply and demand are at work, as always. Advances in fracking along with geopolitical stability (for now) in the Middle East brought prices down well below the marginal production cost. As some of the higher-cost production was curtailed, and as fresh geopolitical turmoil has emerged in Africa, prices have climbed back up.
Great work as always. So maybe the price of oil is getting closer to a sustainable long-run equilibrium?
Depends on what you mean by ‘closer’.
An analysis came across my desk last night suggesting that shale production levels could be sustained with 340 horizontal rigs. There are 328 in the field now.
On the other hand, oil companies have discovered globally all of 738 m barrels this year through July. That’s about 7 days of consumption in 7 months. Well, that’s not sustainable.
I think it’s pretty clear this period ends with a bang, not a whimper. But timing matters. Also, that South China Sea thing.
Stephen,
My guesstimate is that the gross underlying rate of decline in existing US Crude* + Condensate (C+C) production is on the order of about 15%/year, which would mean, using the most recent EIA monthly data for US C+C production (July, 8.5 million bpd), that we need about 1.3 million bpd of new C+C production every year, just to offset declines from existing wells.
Incidentally, as I’m sure you have noticed, recent monthly total product supplied numbers for the US are getting very close to the annual value that we saw in 2005 (20.8 million bpd).
In regard to natural gas, I have been using a Citi Research estimate that the gross underlying rate of decline in existing US gas production is on the order of about 24%/year, which would mean that we need about 18 BCF/day of new gas production every year, just to offset declines from existing wells. In other words, we would need to put on line, every year, more natural gas production that what all of Canada currently produces, just to offset declines from existing wells.
Bother of these estimates are supported by the observed 20%/year net rate of decline in Louisiana’s gas production from 2012 to 2014 (this was the net decline, after new wells were added, so the gross rate of decline was even higher than 20%/year).
*Note that what the EIA calls “Crude oil” is actually C+C
“So maybe the price of oil is getting closer to a sustainable long-run equilibrium?” -Spry
What is a sustainable long-run equilibrium?
If we drop the ‘sustainable’ bit, is not the oil market always in a long-run equilibrium?
I believe you are trying to ask: when will the volatility in the price of oil be reduced so producers and consumers can more easily budget?
$45 +/- is a workable, stable value for a barrel of oil. Fracking costs have plummeted and the Russians and Saudis are well aware of the limitations they now have on the market. The U.S. producers may have cut back for awhile, but can gear up pretty quickly. Additionally, Britain is considering increasing supply.
If there is a buck to be made, producers will not sit on the sidelines… especially now that OPEC is functionally defunct.
http://www.bloomberg.com/news/articles/2016-02-03/texas-toughness-in-oil-patch-shows-why-u-s-still-strong-at-30
http://www.abc.net.au/news/2016-08-26/is-the-slide-in-us-shale-oil-and-gas-production-about-to-bottom/7789196
Pulled it, eh?
Steven Kopits: If you mean the 3 trillion Trump post, yes, because I accidentally posted before my next scheduled posting. It will go live tomorrow AM. In the meantime, suggest you look again at your link – it is for *combined* Afghanistan+Iraq+Homeland expenditures.
Combined US and Chinese Crude + Condensate (C+C) production is down by about 1.5 million bpd from 2015 monthly peaks, which tends to increase the demand for net oil imports from the two largest net oil importers, not even considering changes in domestic consumption. Also, this is the first time since the 2002 to 2005 time period (when annual Brent crude oil prices more than doubled in three years) that US and China net oil imports are both increasing.
The huge difference between then (2002 to 2005) and now is that circa 2002 to 2005, what I define as Global Net Exports of oil (GNE) were showing a strong increase, versus a (so far) continuing post-2005 decline in GNE. Note that what I call ANE (defined below) fell from 41 million bpd in 2005 to 33 million bpd in 2015.
One can find a link to my introductory article on the Export Capacity Index (posted in early 2013), using global production and consumption data through 2011, by search for: Export Capacity Index.
Net Export Definitions
Net Exports = Total Petroleum Liquids Production less Total Liquids Consumption
GNE = Global Net Exports, Combined Net Exports from (2005) Top 33 Net Exporters
CNI = Chindia’s Net Imports
ANE = Available Net Exports, GNE less CNI
ECI Ratio = Export Capacity Index, the Ratio of production to consumption (at 1.0, net exports = zero)
GNE/CNI Ratio is analogous to the ECI Ratio (at 1.0, the Chindia region theoretically consumes 100% of GNE)
Available Net Exports (GNE less CNI)
Using the BP data base, Chindia’s Net (total petroleum liquids) Imports, or CNI increased from 5.1 million bpd in 2005 to 10.9 million bpd in 2015, which I would round off to 5 and 11 million bpd respectively.
In my Export Capacity Index paper, there is a chart showing the GNE/CNI values for 2002 to 2011, using EIA data. Note that the extrapolation (based on the 2005 to 2011 rate of decline in the GNE/CNI Ratio) shows the ratio falling to just below 4.0 in 2015, on track to approach 1.0 (the Chindia region theoretically consuming 100% of GNE) by 2030.
Using the updated data (with four additional years of data, through 2015), the GNE/CNI Ratio fell to 4.0 in 2015 (44/11), on track to approach 1.0 by the year 2032.
What I define as Available Net Exports (ANE, or GNE less CNI) fell from 41 million bpd in 2005 to 33 million bpd in 2015. This is the volume of Global Net Exports of oil available to importers other than China & India.
In other words, we have continued to slide toward a theoretical point in time that we cannot arrive at and still have a functioning global economy.
In any case, here’s the problem: Given an ongoing, and inevitable, decline in GNE, unless the Chindia region cuts their net oil imports at the same rate as, or at rate faster than, the rate of decline of GNE, it’s a mathematical certainty that the resulting rate of decline in ANE will exceed the rate of decline in GNE and that the rate of decline in ANE will accelerate with time.
Based on BP + EIA data, the observed rate of decline in GNE from 2005 to 2015 was 0.4%/year, while the observed rate of decline in ANE was 2.2%/year.
some big supply news with the alpine high discovery by apache, perhaps a few billion barrels of new oil and lots of nat gas. any idea from the experts here, on what the cost of extraction is for this oil patch? any thoughts on the timeline, and how this supply could affect the cost of oil in the next few years? is this new supply enough to limit the upside of oil going forward?
Apache’s reported success in the Alpine High area seems to be consistent with the post-2005 pattern globally, to-wit, natural gas production and associated liquids (condensate and natural gas liquids) have continued to increase while actual global crude oil production (45 API Gravity and lower crude oil) virtually stopped increasing in 2005.
Following is an excerpt from an article I wrote on the topic of actual crude oil versus condensate using data through 2014 (for access, search for title, I seem to be unable to post links). Note that global gas production increased at 2.4%/year from 2005 to 2015, while global Crude + Condensate (C+C) production increased at only 0.8%/year.
My contention is that it took trillions of dollars in post-2005 global upstream capex to keep actual crude oil production from collapsing and on an “Undulating Plateau,” so what happens to actual global crude oil production–the stuff corresponding to the oil price indexes–given the large and ongoing cutbacks in global upstream capex?
Estimates Of Post-2005 US, OPEC & Global Condensate Production Vs. Actual Crude Oil Production
Jeffrey J. Brown
And following is an excerpt from a Business Insider article on a recent HSBC report on global supply & demand (in terms of total liquids). For access, search for the title.
People are almost completely ignoring a looming crisis for oil
HSBC report on the future of oil supply and demand