As the new semester begins, a set of cautionary notes for my students. [Ec435] [PA854]
Forgetting whether nominal or real magnitudes are more important
Often we hear of records being broken. But there are records and there are records. For instance, consider this headline: Nasdaq and S&P 500 Climb to Records. The statement is correct, but it’s lacking in context to the extent that the real, or inflation adjusted, price is more relevant (given that share prices represent valuations of a claim to capital).
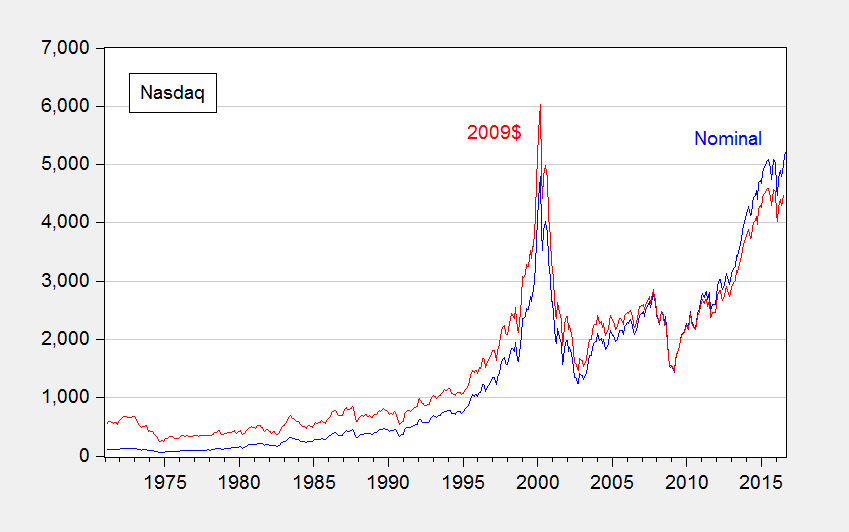
Figure 1: Nasdaq (blue), and CPI-deflated (red), in 2009$. Source: NASDAQ via FRED, BLS, and author’s calculations.
Now, some people evidence wariness about deflation, particularly in terms of the accuracy of the deflators. However, it is usually better to account for price level effects and note the concerns, rather than rely on people to keep their preferred deflators in their head to calculate the real magnitudes (see this post).
Adding up chain weighted quantities
While in many cases, real magnitudes are the relevant ones, working with real magnitudes is not always straightforward. For instance, in principle, if one had data on real consumption by households in Wisconsin and household in Minnesota, and one wanted to add them up to find real consumption in Wisconsin and Minnesota, one could do that by deflating each state’s consumption by the CPI and adding. That’s true because the CPI is essentially a fixed base year weighted index (in this case, a Laspeyres index, using the initial weights).
This is not true for the series in the national income and product accounts, such as the components of GDP. The real measures – consumption, investment, government, net exports — are obtained using chain weighted deflators, i.e., deflators where the weights vary over time.
Can one make a mistake this way? Certainly. Consider this recent case at Political Calculations, wherein the commentator added up the state level real GDPs and because it didn’t match the national level GDP, the commentator inferred a massive impending downward revision in GDP.
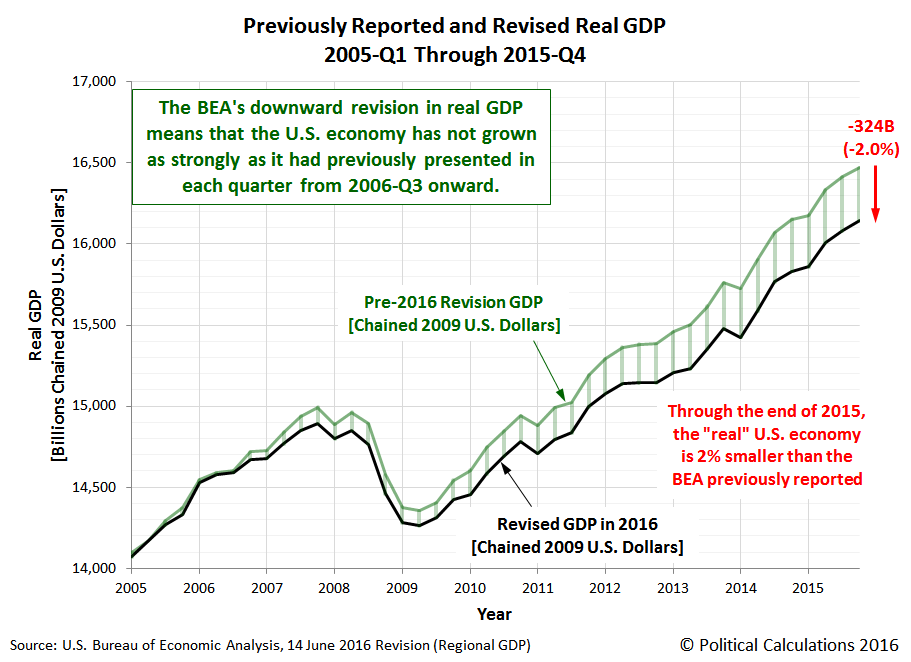
Source: Political Calculations.
Needless to say, the massive downward revision did not occur. Overall, real GDP was revised slightly upward. Figure 2 depicts what actually transpired.
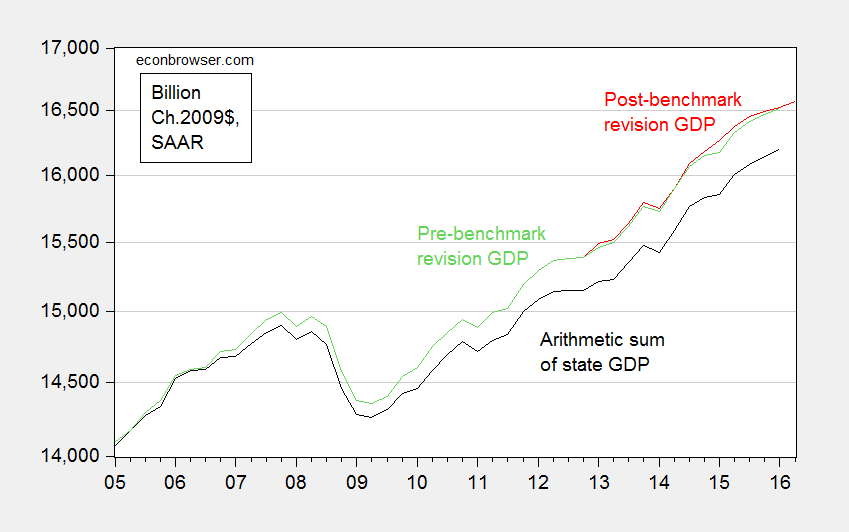
Figure 2: Real GDP pre-benchmark revision (green), post-benchmark revision (red), and arithmetic sum of state level GDP (black), all in Ch.2009$ SAAR. Source: BEA 2016Q1 3rd release, 2016Q2 advance release, BEA state level quarterly GDP, revision of 27 July 2016, and author’s calculations.
More discussion in this post. Now, sometimes one wants to express ratios of real magnitudes. This post discusses one way at getting at something like that.
Forgetting what “SAAR” means
SAAR is short for Seasonally Adjusted, at Annual Rates. Most US government statistics are reported using this convention, even when the data are at a monthly or quarterly frequency. (In contrast, European quarter-on-quarter GDP figures are often reported on a non-annualized basis.) Most prominently, quarterly GDP is reported at annual rates, so when one sees 18,000 Ch.09$ in 2016Q2, that doesn’t mean the flow of GDP was 18,000 Ch.09$ in that quarter; rather that if the flow that occurred in 2016Q2 continued for a whole year, then GDP would be recorded at 18,000 Ch.09$.
Now, this does not matter if one is calculating percentage growth rates (as long as one also remembers to annualize the growth rate if one is calculating quarter-on-quarter changes). It does matter if one is calculating a “multiplier”, the increase in GDP for a given increase in government spending. That’s because the government spending increase (or stimulus) is sometimes reported in absolute (non-annualized) rates, and GDP in SAAR terms. Obviously, if one did the mathematical calculation forgetting this point, one’s multipliers would look four times as large as they should. If compounded with failing to take into account annualizing growth rates, then they would look sixteen times as large as they should. Even professional economists make this mistake – consider the case of this University of Chicago economist, who thought “…the multiplier is 20 or 50 or something like that” because he was essentially dividing a quarterly stimulus figure by an annualized figure, and forgetting that growth rates are typically reported at annualized rates.
What about the “SA” part of the SAAR? Most of the time, one wants to use seasonally adjusted series; in fact, this is almost always what is reported in the newspapers. The reason is that there is a big seasonal component to many economic variables; retail sales jump in December because of the Christmas holidays, for instance.
Occasionally, people (usually noneconomists) get into trouble when they mix and match seasonal and non-seasonal data. For instance, Wisconsin Governor Walker’s campaign got into trouble when they touted job creation numbers obtained by adding together seasonally unadjusted jobs figures (from what is called the Quarterly Census of Employment and Wages) with seasonally adjusted jobs figures (from the establishment survey) to get a cumulative change in employment. (They did this because QCEW figures lag by many months, while the establishment survey data are more timely). This is shown in Figure 3.
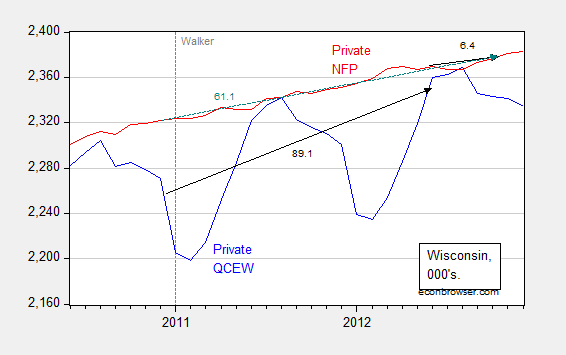
Figure 3: Wisconsin nonfarm private employment from Quarterly Census of Employment and Wages, not seasonally adjusted (blue), private nonfarm private employment from establishment survey, seasonally adjusted (red). Black arrows denote changes over QCEW and establishment survey figures; teal arrows over establishment survey. Source: BLS.
Notice that one can calculate the changes from December 2010 (just before Walker takes office) to March 2012 (the latest QCEW figures available as of December 12, 2012), and then add to the change from March 2012 to October 2012 (the latest establishment figure available as of December 12, 2012). That is, add 89.1 to 6.4 to get 95.5 thousand, close to the 100 thousand figure cited by Governor Walker’s campaign. You can see why Governor Walker’s campaign officials did so – the correct calculation using the change in the establishment survey from December 2010 to October 2012 was only 61.1 thousand.
Log aversion
Oftentimes, we depict economic statistics in log terms. The reason for this is that when plotted over time, a variable growing at a constant rate will look like it is accelerating if the Y-axis is expressed in level terms. However, it will look like a line with constant slope if the Y-axis is in log terms.
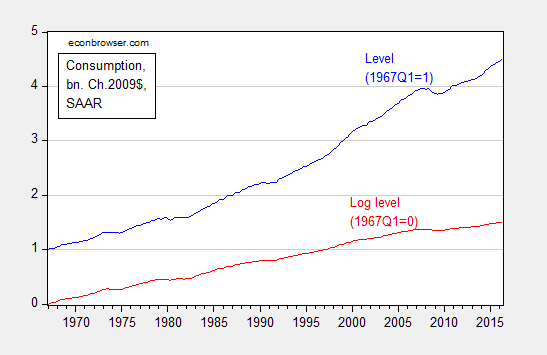
Figure 4: Real consumption, normalized to 1967Q1=1 (blue), and log real consumption, normalized to 1967Q1=0 (red). Source: BEA, 2016Q2 second release, and author’s calculations.
Solely examining the level series, consumption appears to be accelerating, particularly in the 2000’s. That illusory acceleration disappears in the log series.
For more on log transformations, see [1], [2], [3], [4], and [5]. And here’s Jim Hamilton’s post on logs. Here is an example of where the use of logs has driven someone to ranting and raving.
Shadowstats and other data conspiracies
It is not uncommon for commentators to allege conspiracies to manipulate government economic statistics. Take this FoxNews article:
What a coincidence. Just as momentum was building towards an interest rate hike by the Fed, along comes a dismal jobs report that takes any increase off the table. Contrary to the general perception, this is a lucky break for Democrats. … Given all that is stake, it is surprising that no one has questioned whether the jobs report might have been massaged by the Labor Department.
In modern times, these types of allegations are unfounded. The data series might not be particularly accurate, but deliberate manipulation to distort the economic picture does not occur for standard series released by the BEA, BLS, and Census.
One particularly egregious form of conspiracy-mongering is Shadowstats, a money-making enterprise that purports to provide a more accurate set of price measurement. Instead of going into detail, I will turn the case over to Jim Hamilton, who thoroughly debunks the Shadowstats approach. Anybody who cites Shadowstats should immediately lose all credibility. So … don’t do it!
More data conspiracies, see here.
Very good. I have a point I make with those claiming that the data is deliberately manipulated.
I have an equation of S&P 500 earnings as calculated by Standards and Poor’s using BLS & BEA data –the business deflator and unit labor costs. If there was a problem with the government data the equation should break down over time and generate results that are increasingly inaccurate. But, interestingly, the equation actually is giving me better results as time goes by — just the opposite of what would happen if the government data was getting more inaccurate.
Professor Chinn,
The Shadowstasts link did not work. Also, may be a typo above, See the “his they” below.
“For instance, Wisconsin Governor Walker’s campaign got into trouble when ‘his they’ touted job creation numbers obtained by adding together seasonally unadjusted jobs…”
This amateur appreciates the review of proper presentation and analysis.
AS: I fixed the links. Thanks for catching this.
Menzie Regarding seasonally adjusted data versus non-adjusted data, I was always taught that it was better to use non-adjusted data and then seasonally adjust within the model if the seasonally adjusted series used different detrending and filtering parameters.
2slugbaits: Yes, this is what would be preferable, but sometimes this is not feasible. For instance, there is no seasonally unadjusted GDP series, so if one wanted to estimate a money demand equation, the best that could be done is to regress money on GDP and interest rate, where both money and GDP were seasonally adjusted using the same filter.
Dear Prof. Chinn,
We Hunted the Mammoth is an important blog devoted to fighting online misogyny and supporting feminist goals :
http://www.wehuntedthemammoth.com/
Please support this important goal.
Looks like someone is on to your pseudoscience.
https://politicalcalculations.blogspot.com/2016/09/examples-of-junk-science-ignoring.html
Captain America: That post made me laugh and laugh and laugh. I will use it as a case study the next time I assign my econometrics class an analysis to dissect. Hint about why you too should laugh — he’s doing a bivariate correlation analysis. He’s not worrying about partial correlations, which is the least I’d want to do. But I’ll dissect his latest opus in a post soon. (You should also be wary of reading a post by someone who has regularly added together chain weighted series with apparently no worry about why it makes no sense, and has also asserted that the Obama administration has fostered international turmoil in order to lower Federal government borrowing costs — ’nuff said).
I promise he will also make it into my year-end review again (last installment is here).
captain america, that link is a demonstration of the results of an amateur trying to conduct “legitimate” science. for one, your link and arguments are so convoluted they really cannot even be followed through in detail. there is a reason menzie has a field day tearing apart your arguments-they are stupid. you will continue to look foolish if you pick fights with professional economists. captain america, stick to your target audience of the uneducated and foolish-they will be more accepting of your deficiencies.
Good post. One comment on SAARs: they are quite useful unless some basic driver abruptly changes. That doesn’t happen often, but when it does it is quite disruptive. This can happen when seasonality is artificially induced by policy or programs. For example, automotive sales seasonality changed when “new model introduction” stopped occurring for all models in September.
History can be quite helpful in understanding the present, but the present must be understood to know whether history is still relevant.
Menzie: Terrific essay. I envy your students.
Erik Poole: Thanks, you’re very kind. I hope my students are equally appreciative!
Data conspiracies, eh?
Hmmm.
It could be that people have questions about the official line (4.9% unemployment) versus what they see in their everyday lives (ex: more houses up for sale every month). It’s bad optics especially in election years when the official line can’t be explained to the public’s satisfaction (hence Donald Trump).
There probably are some good reasons for conspiracies:
1. The data is not explained clearly nor properly, leaving it open to questions and interpretations
2. People are questioning the sources (which is always good) and not getting a good answer (hint: “that’s irrelevant” is not a good answer)
3. The people creating the data may not be asking the questions themselves (in other words, they are just following the process)
My problem has always been with the BLS numbers. Compared to the Great Depression, today there are too many buckets unemployed are in that don’t seem to be counted.
Maybe Jim Hamilton could explain all that in a post. If so, I’ll give him my questions.
Btw, I finished reading two good books on ranking the presidents:
1. Presimetrics by Mike Kimel & Michael Kanell (thanks to one of your commenters)
2. Bulls Bears and the Ballot Box by Bob Dietrick &Lew Goldfarb
Last…
In addition to writing about the WI and KS economies, you might also want to include IL. Unlike the dopey futwicks Walker and Brownback, Rauner seems completely out of his element (business as opposed to politics). He says “jump” and the opposition doesn’t say “how high”, they merely flip him off (yep, we ain’t WI). Rauner has sent lotsa money to the Illinois Policy Institute (IPI), a right-wing think tank masquerading as a news organization that publishes articles by Scott Reeder and Austin Berg in newspapers. The State Journal-Register’s Bernie Schoenburg has done good work on writing about IPI. For instance, in southwestern IL, you can find opinion pieces (by Reeder & Berg which flat-out lie about things) and IPI articles in the Alton Telegraph (owned by a billionaire in PA) under the byline of “Staff Reporter” (the key is they almost always quote something from IPI though). Crain’s Chicago Business endorsed Rauner for governor in 2014, but recently published an article saying “never mind” ( http://www.chicagobusiness.com/article/20160625/ISSUE07/306259997/gov-rauner-youve-proved-us-wrong ). And of course, this doesn’t help: Bloomberg’s Justin Fox article on Where Median Incomes Have Fallen (and Risen) Most ( https://www.bloomberg.com/view/articles/2016-08-19/where-median-incomes-have-fallen-the-most ) with IL falling 16.6%.
You also might want to comment on IA and Branstad’s attempt to privatize Medicaid, which has turned into a predictable, expensive mess. Lotsa, lotsa fun.
There probably are some good reasons for conspiracies:
1. The data is not explained clearly nor properly, leaving it open to questions and interpretations
2. People are questioning the sources (which is always good) and not getting a good answer (hint: “that’s irrelevant” is not a good answer)
There is a reason for that, namely the talking heads who profess to know everything and uses angle that leaves it to open interpretation. I have an example of using Limbaugh when he uses the “jeopardy argument” stating the conclusion of Obama’s policies before he was elected while professing the conservative policies works when data don’t lie. The same goes with O’Reilly and Hannity. Don’t even get me started with Arthur Laffer.
I think I get the point of this education. Better keep my conservative beliefs to myself in this class, since the examples of the rookie mistakes seem to involve conservatives.
My biggest fear is that I might blurt out a question about how we really know that the multiplier is bigger than 1. But that question could be misinterpreted as evidence of conservative beliefs. Just gotta keep telling myself, the stimulus worked, the stimulus worked….. until after the final exam.
jr, it sounds as though you may have been home schooled, perhaps by an uneducated father. your best course of action is to attend class regularly and listen to what Prof. Chinn has to say on economic matters. then over break, go home and educate your father on his deficiencies. you will both benefit from Prof. Chinn.
What you’re saying is so typical. If I may paraphrase: “Don’t try to shake that ignorance with facts and data because I know you really are looking for ways to distort my conservative values. I revel in my ignorance. It’s my god-given right as an american to be as stupid as I want to.”