One of the exciting implications for economists of the digitization of everything is the ability to study economic relations and behavior at a level of detail far beyond anything that could have been attempted a decade ago. I’ve earlier called attention here to new measures of inflation obtained from millions of prices posted on the web, new insights into pricing behavior coming from scanner data on individual store transactions, and understanding of consumer behavior based on debit and credit transactions of 25 million Americans. Here I discuss another new study based on smart-phone apps.
Many Americans track their checking and credit card accounts using financial apps. A new paper by Michael Gelman, Yuriy Gorodnichenko, Shachar Kariv, Dmitri Koustas, Matthew D. Shapiro, Dan Silverman, and Steven Tadelis uses these data from over a million users of a financial app to draw some new conclusions about consumer spending behavior.
Here for example is the kind of data we used to rely on. It comes from the Bureau of Labor Statistics’ Consumer Expenditure Survey, which asks people to report how much they spend on gasoline each month. It’s obvious that at a minimum there is a lot of rounding and reporting error, with people reporting $200/month instead of $190 or $210, for example.
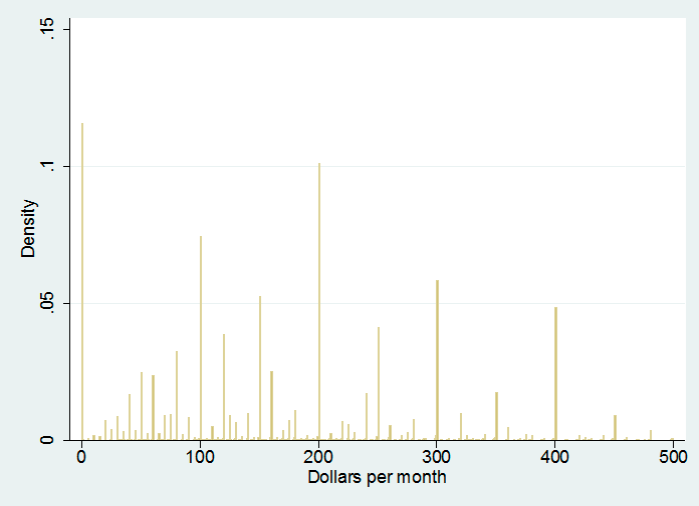
Fraction of people reporting spending indicated amount on gasoline each month based on the CEX interview survey. Source: Gelman, et al. (2016).
By contrast, the authors find over 20% of app users make no gasoline purchases in any given month. Once the zero spenders are taken out, we see as expected that spending is more smoothly spread out.
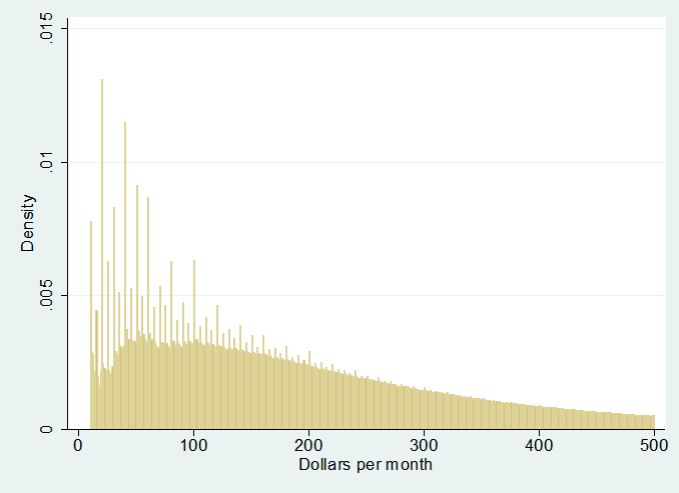
Of app users who spend a positive amount on gasoline, fraction who spend indicated amount. Source: Gelman, et al. (2016).
The particular focus of the paper is on how consumer spending changed in response to the big drop in gasoline prices in 2014. Lower gasoline prices meant a big windfall in spending power for the people at the right end of the above distribution, who had been spending hundreds of dollars each month on gasoline, compared to those at the left end, who spent little or nothing. The authors find that consumers essentially spent all of the money they saved on gasoline on other goods and services. That finding is similar to the JP Morgan Chase Institute analysis of individual debit and credit transactions as well as Baumeister and Kilian’s recent analysis of aggregate U.S. consumption spending in response to the oil price decline.
And it’s also consistent with something I’ve been saying here for a long time: changes in oil prices are an important factor in driving changes in consumer spending.
It looks like over 190 million Americans have drivers licenses. They drive an average of 1,100 miles a month. At 25 miles to a gallon, they use 44 gallons a month. At 20 miles to a gallon, they use 55 gallons a month. A $1 drop in gasoline prices saves them $44 or $55 a month.
Of course, the big beneficiaries are commercial drivers, i.e. truck drivers, delivery drivers, taxi and uber drivers. And of course, some don’t benefit at all.
When I lived in Oakland, in the embarcadaro, the house across the street was converted into rooms. Five illegal immigrants lived in one small room! All five would ride their bicycles together, apparently to work, almost everyday, and around 10 hours later, or so, they all rode back together. They would swoop down the street to the front door and bring their bicycles inside. I don’t know if they kept their bicycles in the tiny room. They lived in that room for years. I guess, it was an improvement compared to where they came from.
peak, how did you know they were illegal immigrants? did you ask them?
Why would I ask them? It’s none of my business. They didn’t speak English anyway.
you called them illegal immigrants. but how do you know? because they spoke something other than english? my grandfather was a us citizen, spoke broken english and often spoke in his native tongue to those around him. would you have called him an illegal immigrant as well?
as i asked, you called these individuals illegal immigrants. but i doubt you had any evidence of their actual status.
If you must know, the Hispanic, who may speak English better than you, along with speaking Spanish, lived above them, and worked on my car a couple of times told me, although I particularly didn’t want to know. How many illegal immigrants were there in your grandma’s day? Do you not believe there are illegal immigrants – maybe tens of millions – in the U.S., not counting tens of millions of legal immigrants? It’s possible, they weren’t really illegal immigrants. Maybe, they were just a group of people who liked being quiet and not drawing attention to themselves, living and working in the shadows.
“How many illegal immigrants were there in your grandma’s day? ”
i know many came through ellis island with no/improper/inaccurate documentation. today we would call them illegal immigrants.
so your source for the illegal immigrants status was a second hand passing reference. ok. i thought perhaps you actually interacted with them-my mistake.
The personal savings rate has risen by roughly a full percentage point since the collapse of oil prices. All else equal, would this not imply Americans have changed their marginal propensity to consume due to lower energy prices?
Good article – thank you for this post.
I’ve found the stream of data available can be very easy to manipulate and paint just about any picture you’d like. Going back to fuel prices and spending habits – we saw a very different picture locally (South Texas, Houston to Laredo). When fuel prices fell, so did consumer spending on a broad scale. The reason, obviously, was the mass amount of layoffs in the oil sector, which contributed heavily to employment locally. However, when analyzed closer, the consumers that were still spending (presumably due to jobs that did not rely directly on the oil industry), spending went up, and has stayed in 6% to 10% positive territory. Granted, the increase from those still spending did not make up for the difference in those that cut back.