Here are graphs of employment, industrial production, personal income ex.-transfers, manufacturing and trade sales, and real GDP (five indicators that the NBER Business Cycle Dating Committee has focused on in the past) depicting the state of the macroeconomy, given what we know today, and compared to eight years ago.
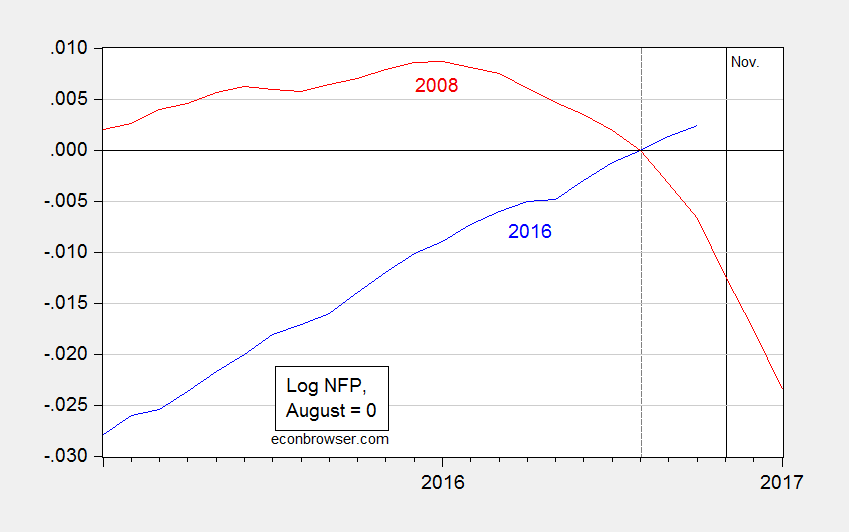
Figure 1: Log nonfarm payroll employment current (blue), and eight years ago (red), both normalized to August. Source: BLS via FRED, and author’s calculations.
Nonfarm payroll (NFP) employment growth from trough (2007M12) to current (2016M10) is 10.1%; prior trough to peak (2001M11 to 2007M12) was 5.3%. NFP employment growth from peak (2007M12) to current (2016M10) is 4.6%; prior peak to peak (2001M03 to 2007M12) is 4.2% (all calculations in log terms).
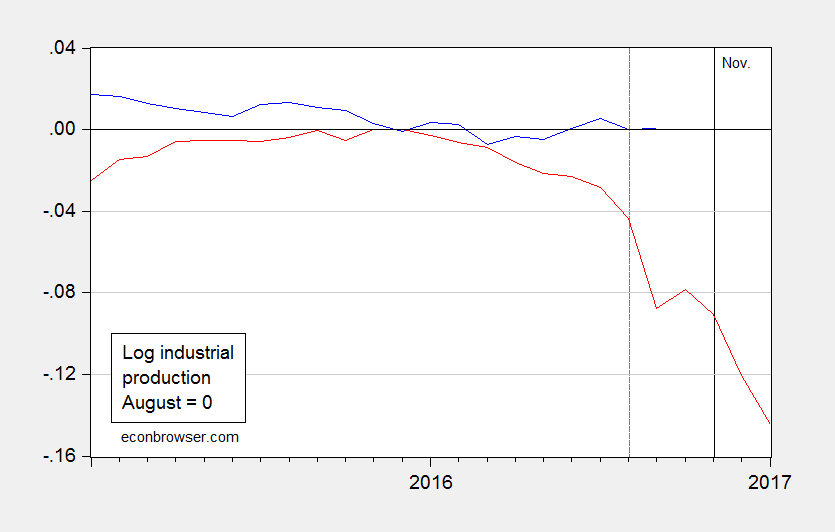
Figure 2: Log industrial production current (blue), and eight years ago (red), both normalized to August. Source: Federal Reserve Board via FRED, and author’s calculations.
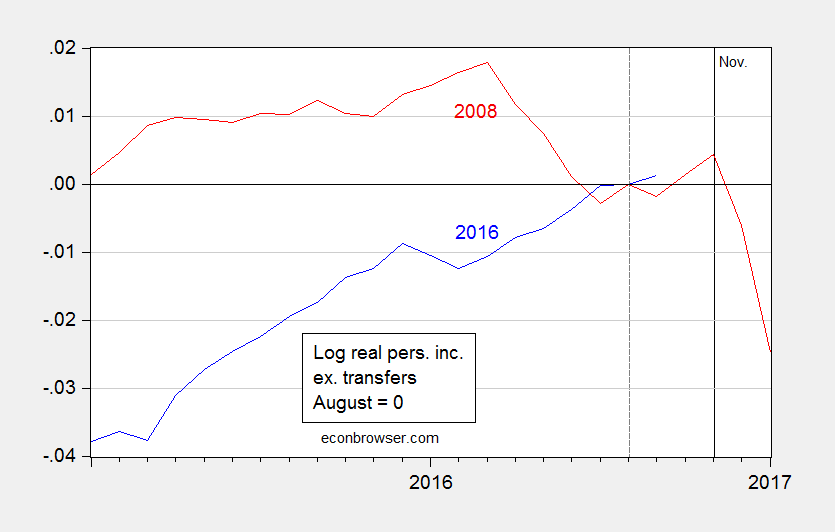
Figure 3: Log personal income excluding transfers, in Ch.2009$ current (blue), and eight years ago (red), both normalized to August. Source: BEA via FRED, and author’s calculations.
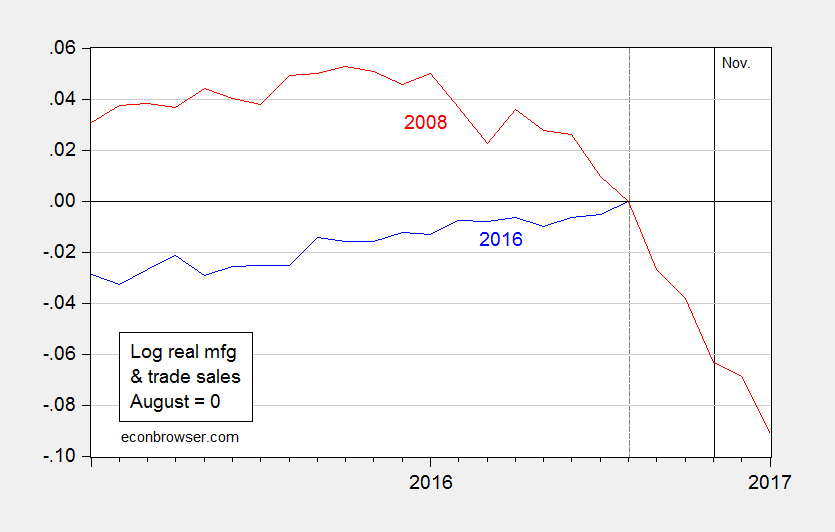
Figure 4: Log manufacturing and trade sales, in Ch.2009$ current (blue), and eight years ago (red), both normalized to August. Source: BEA via FRED, and author’s calculations.
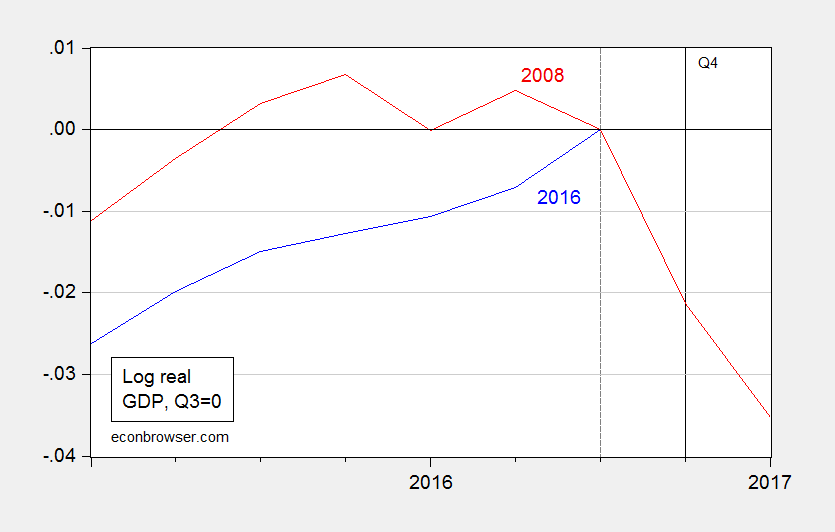
Figure 5: Log GDP, in Ch.2009$ current (blue), and eight years ago (red), both normalized to Q3. Source: BEA (2016Q3 advance release), and author’s calculations.
I find it somewhat interesting that you picked your data to begin 2007M12 and end 2016M10. Although the NBER Business Cycle Dating Committee decided 2007M12 as a peak in economic activity, the FOMC began cutting rates before that date, I believe in its 2007M09 meeting suggesting FOMC participants felt economic activity was deteriorating before 2007M12. As such, is there any reason besides just sticking with the NBER’s official date as to why you didn’t choose the 2007M09 date? Or perhaps another date altogether, such as one to truly look at a full 8 years as opposed to looking at (7+((an arbitrary # of months to make a political statement)/12))years instead? Or, maybe I’m trying to find something interesting that isn’t there at all (I’ll bet you’ve never done that). I could simply be missing the point of this blog post completely 🙂
rtd: I am dubious about your September 2000 date, for reasons discussed at length here.
However, even if I use 2007M09, then the prior trough to peak is 5.2%, compared to current 10.1%. For prior peak to peak, it’s 4%, compared to current 4.8%. Does that change the story using your arbitrary peak dates? I could use ECRI’s judgment. That would yield…exactly the numbers I gave in the post, since their judgment matches that of the NBER.
By the way, I normalized to August because that’s the latest date for which all five series had observations as of yesterday.
So, keep on trying to twist yourself into contortions to try to figure out a better set of dates to normalize to; you can even call ’em Hibbert dates if you want, and I’ll cite!
This one flew over your head.
I’m not “try[ing] to figure out a better set of dates” as much I am trying to understand your approach. Seems almost as if you’re attempting to equate economic activity to the election cycle given the timing of the post. I’m of the opinion that the FOMC matters much more than politicians. But, again, maybe that wasn’t your intention at all and I’m trying to find something interesting that isn’t there at all. You know what I mean? Of course you do.
Noting your normalizing to Aug makes sense yet is irrelevant…. but thanks for the explanation, I suppose.
Also, you have a typo.
rtd: Motivation for this post? Some fella, in response to a query about why look at differential economic performance during different administrations, wrote about the Blinder-Watson paper:
So, your justification for looking at a single administration while ignoring a (hopefully) once in a lifetime monetary response is to cite research which analyzes 6.5 decades of data? At what point in the semester do you teach your students to ignore outliers and shocks in data and to attribute monetary policy’s impact (or lack therof) to the executive branch? Or, maybe the focus of your lectures is solely on Zimbabwe.
In any case, I’m flattered I motivate you.
My comment seems to have been deleted & I can’t remember what I typed.
Anyway, let’s go to Blinder & Watson’s conclusion:
“Democrats would no doubt like to attribute the large D-R growth gap to better macroeconomic policies, but the data do not support such a claim…..It seems we must look instead to several variables that are mostly “good luck.”…..These three “luck” factors together (oil, productivity, and ICE) explain 46-62% of the 1.80 percentage point D-R growth gap. The rest remains, for now, a mystery of the still mostly- unexplored continent. The word “research,” taken literally, means search again. We invite other researchers to do so.”
Menzie,
These charts seem to show that we were in a recession in 2008 but that the data are clear that we are not in recession in 2016. Interesting. Can your next post cover whether equity prices fluctuate? Many people are confused about that. Maybe some charts would help.
Menzie,
The voters aren’t buying your charts. Looks like Wisconsin just elected Trump president.
Americans have spoken.
We want our country back, and no amount of media spin and left wing econbrowser “the sky is falling” is going to stop us. At least he will be the first President ever who will not have to hand out favors left, right and center to pay off past goodwill.
Econbrowser, your pro-Hillary propaganda and campaigning over the last few months has been sickening. Clearly people don’t want to be told who to vote for.
Everyone was against Trump. EVERYONE. He had zero help from the media. I counted 17 links to anti-Trump articles at one point on the front page of the Washington Post. SEVENTEEN. They were ruthless and unashamed of their blatant biased anti-Trump coverage. Hello, Menzie !
Trump had zero help from fellow Republicans, including those running against him in the primary who promised to endorse the winner – and then broke that promise (Ted Cruz. John Kasich. What desk are you hiding under this morning ?) How about Paul Ryan – the slime who refused to back him after the unfounded sexual allegations surfaced from the Democratic camp?
He overcame all the odds and still came out on top…
You know why?
Because he will be our next Ronald Reagan. And let us not forget Obama’s hopey changey lies from 2008 !
“He had zero help from the media.”
only if you overlook the overwhelming support from the largest news media machine in the country, faux news. convenient how you forget their influence.
Forgot this chart: http://data.bls.gov/timeseries/LNS11300000
and some of the details in this: http://www.bls.gov/emp/ep_table_303.htm
while incomes have stagnated https://fred.stlouisfed.org/series/MEHOINUSA672N
then add in health care costs and tuition cost increases.
They paint a different picture than the macro charts in this post and are “triggers” for the working class Democrats who defected to Trump. Perception is reality regardless of statistics.
These are the right graphs, I think.
The average Joe has not seen a wage increase since 2000, has taken a huge hit from Obamacare, and feels ignored by the establishment. The uneducated, rural white saw one of their own in Trump, and they took the opportunity to elect him.
Just incredible.
There is no need to reinvent the economic forecasting wheel. There are a bunch of time-tested economic models that forecast election returns, and they all forecast a very tight popular vote, with most of them putting the incumbent party slightly ahead.
And that is exactly what happened, since as of this writing Clinton has a slight lead in the popular vote. The best was the model that makes use of the Index of Leading Indicators through Q1 of the election year, and gives increasing weight to each quarter starting from Q1 of the first year of the Presidential term. That gave Clinton slightly under 50% of the total vote for all candidates.
I’ll have to go back and dig out the links. I’ll update with those if you would like.
I’m not understanding your point. The FRED chart shows that median wages were increasing. I have no doubt that white working class men felt like they were falling behind in relative terms, but they clearly were not falling behind in absolute terms. A better interpretation is that they no longer felt superior to other non-whites, and this made them feel poorer. Uneducated white guys are like that.
That said, rural Americans who supported Trump will likely be in for an unpleasant surprise late spring/early summer. The 10 yr yield jumped about 21 basis points today, the dollar surged against key export markets and grain prices fellow significantly across all futures contracts. Corn is now under $3/bushel, which means farmers will be in dire straits next spring. If Trump pushes his anti-Mexico and anti-trade stuff, grain export markets will collapse. We already use 40% of our corn to produce ethanol and that requires huge subsidies. And 13% goes to feed livestock. The rest pretty much goes to Mexico. So to all those farmers in rural America who voted for Trump, let me tell them that if they liked the 80s farm crisis they’re going to love what’s coming up. The ag economy was already pretty squishy before Trump’s big night.
2Slug, no doubt that incomes have been rising, but the chart also clearly shows that they are, on average, lower than the prior two peaks. The “on average” is a little misleading when you recognize that the labor participation rate is down. So, some people are doing pretty well, but there are more people who are not.
Here in Michigan, it was not the “farmers” who swung the vote; it was the blue collar workers (specifically Macomb county, a traditional blue county) that couldn’t relate to the Obama/Clinton/progressive agenda. Detroiters expressed their disappointment with that agenda in a different manner: they stayed home. Ohio voters for Trump were not farmers; they were the former manufacturing workers. Pennsylvania voters for Trump were not farmers; they were http://billypenn.com/2016/11/09/how-donald-trump-won-pennsylvania-then-the-white-house/. Even Wisconsin voters, under the progressive-maligned Scott Walker, selected Trump.
Now, I’m not claiming the vote was fully rational, but it wasn’t fully irrational either. Economics was part of it; especially Obamacare and the escalating costs of insurance in general. Some of it was a perception that Clinton was a modern Marie Antoinette; that she was a political insider who felt entitled and above the law. Some of it was the sense that Washington and big business were colluding against the American worker: http://www.nytimes.com/2016/01/26/us/lawsuit-claims-disney-colluded-to-replace-us-workers-with-immigrants.html?_r=0. Some of it was a sense, correct or not, that the Obama/Clinton forces were paying more attention to and providing more assistance to illegals and unvetted immigrants than the chronically poor and unemployed Americans.
So, yes, some farmers voted for Trump and some may regret that vote, but it was much broader and bigger than that. And that’s what cost Clinton the election. http://www.frontpagemag.com/fpm/264771/american-uprising-daniel-greenfield (you don’t have to agree with the reasoning; you only have to recognize the reality).
the uneducated, white working class felt they were no longer in the privileged class, others were getting a better deal, so they staged an uprising. understandable. but one should acknowledge, the feeling that other groups are privileged and advantaged, is the lifestyle most minorities have lived their entire lives. the uneducated white class felt it for a decade and vented-not a lifetime. but that white class is dwindling in numbers. perhaps by the next election, that minority group may become the majority. when they stage an uprising, will you be accepting as well? trump has his work cut out for him.
baffling, your characterization of blue collar union-type workers as uneducated and privileged might draw an objection from those hard-working people. If you worked in a steel mill or assembly line, you might have a different perspective. Perhaps sitting behind a desk is “privileged”.
bruce, i did not mean uneducated as in stupid. i meant, without a higher education degree. this means their upward mobility potential becomes more limited without a college (or high school) degree. by privileged, it is meant the right to a high paying, steady job without having a college degree. bruce, i grew up in a steel mill town, and understand many of those folks are hard working. but hard working does not automatically mean you deserve a high paid, steady job. lots of minorities are hard working, and they do not have that privilege in their local environment. but there is a viewpoint amongst that group that by being hard working, they are entitled to a well paying job. that world really no longer exists, unfortunately.
The losers in this election were as follows:
– The Republican party for their failure to support the party’s nominee. Trump won the party’s nomination in a hard fought contest. The Rep. D.C.elite who assume that it is they who should determine who the candidate will be because the “unwashed” are not nearly capable enough to make that decision.
– The media who went out of their way to display their leftist bias and their willingness to tell outrageous lies to assure their candidate [Hillary] win. They have proven beyond a shadow of a doubt that they cannot be trusted.
– The Democrat party which has drifted so far, it is barely recognizable in this day. I can remember when the party was actually concerned for those who were not the super-wealthy, the party also promoted a healthy value system and love for our country, but sadly a long time ago.
– President Obama. I didn’t vote for him but hoped he would do well after his election. I was never in favor of him, I never said he was “not my president”, but he did disappoint.This election said everything about his legacy.
The winners were the people. This was not a Republican victory. Trump won in spite of the Republicans. This was a non-violent revolutionary movement of the decent ,hardworking people of America who made their voices heard in 2016. God Bless America ! And good morning, Menzie from Wisconsin.
Menzie:
Now that I have been told that you are a ‘left-winger’, I am not sure I can continue to follow this blog.
I sure hope the new regime puts bright people in place that will help me think. Thinking is so hard….
Clinton talks about, the American dream, hope, commitment, dedication, fighting for what you believe in, freedom.
Trump talks about jobs lost, trade tariffs, security, infrastructure, investment, business opportunities.
Clinton has spent 30 years in politics, talking a good game. In 30 years, never was so much crap said, by so few, to so many. Wheel that corrupt mob out, and get America back to work and prosperity.
Clinton and Obama could talk all night, and leave it all unsaid. ‘Dreams’ don’t pay bills, though Clinton has forgotten that.
Folks, in the background, US real per capita GDP has been steadily increasing.
This economist’s model correctly predicted the outcome:
https://pollyvote.com/en/components/econometric-models/fair-model/
The model suggests if Cruz was nominated (instead of finishing second), it could’ve been a landslide (although, Cruz wasn’t liked by his colleagues).
The Inconvenient Truth Behind Donald Trump’s Victory
https://realinvestmentadvice.com/the-inconvenient-truth-behind-donald-trumps-victory/
Binyamin Appelbaum: A massive repudiation of mainstream economics and its role in public policy.
Pretty much nails it.
the problem with the linked website, is the inconsistency with which it presents the data (various start points) which are probably used intentionally to strengthen an argument in a way that may not be valid. it also uses innuendo and false analysis to present its case. for example, the plot and commentary on the labor participation rate implies it is failed economic policy which created the rise and then fall of the labor participation rate from the 1970’s. the real reason is demographics of both the baby boomer generation as well as increased women ini the workplace. the credibility of other points the site tries to make is diminished by such improper considerations.