Today we are pleased to present a guest contribution written by Jason Brown, Senior Economist and Regional Executive at the Federal Reserve Bank of Kansas City. This post is based on the article by the same title. The views expressed are those of the author and do not necessarily reflect the positions of the Federal Reserve Bank of Kansas City or the Federal Reserve System.
Although the U.S. economy is in its eighth year of expansion since the Great Recession, some states are nevertheless in recession. The timing of states entering an economic downturn often differs from the nation as a whole: the onset and duration of recessions depend on factors that typically differ in each business cycle. A global recession such as the Great Recession is often widespread, dampening economic growth across most regions and sectors of the United States. But other downturns may be more concentrated.
States with higher concentrations in specific sectors may enter downturns earlier than other states—and may remain in them longer. For example, energy-producing states in the Tenth Federal Reserve District entered a recession in 2015 and 2016 following the 70 percent decline in the price of oil from June 2014 to February 2016. In contrast, most non-energy-producing states experienced moderate but steady growth over the last two years (Map 1). Energy-producing states have a larger share of employment and output in the oil and gas sector; as a result, declining or sustained low oil prices can decrease exploration and drilling, decrease activity in other sectors, and thereby dampen overall economic activity.
Map 1. Growth in the Economic Activity Index by State, Sept. 2015 to Sept. 2016.
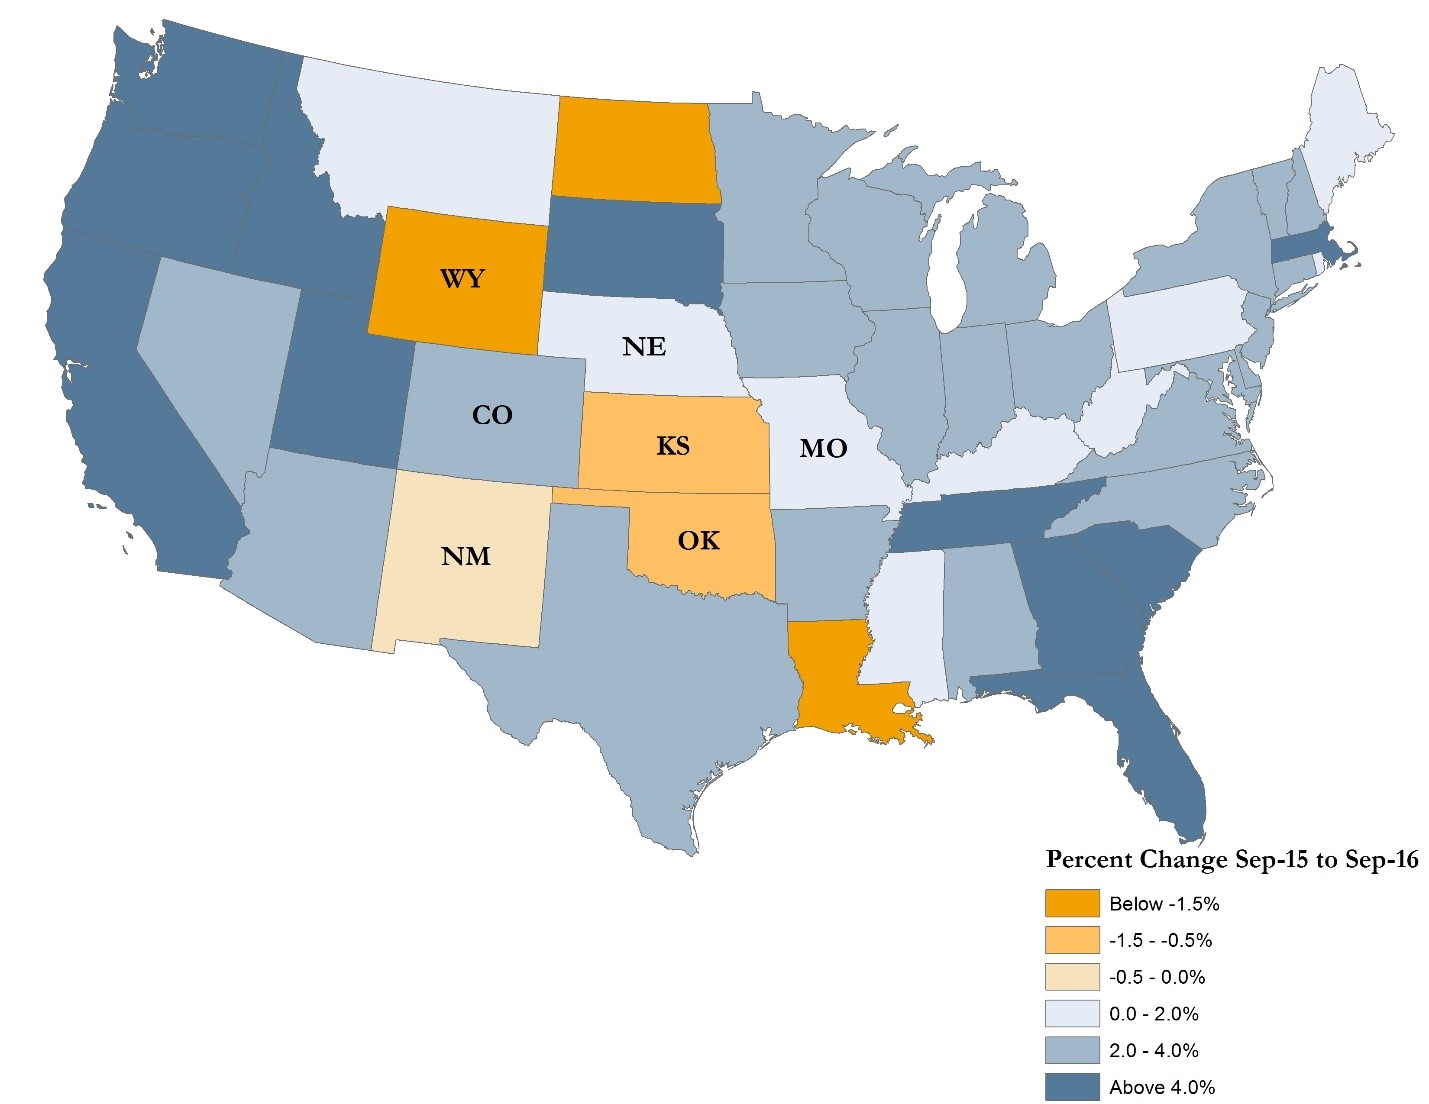
Source: Federal Reserve Bank of Philadelphia and author’s calculations.
Two possible approaches for identifying state-level recessions
Using changes in each state’s coincident index to measure growth, I implement two approaches to determine whether the seven states of the Tenth District are in a recession.
The first approach I use is the Bry-Boschan method, which is helpful for identifying regional recessions retrospectively over the last four decades. The B-B method simply identifies peaks and troughs in the data series.
The second approach, Hamilton’s Markov regime switching model, is more helpful for identifying state recessions in real time. It allows the average growth rate to switch between different regimes (for example, between a high-growth and low-growth regime). The timing of these regimes and the growth rates within them are then estimated from the data (See the full article for more details on the methods).
When applied to the seven states of the Tenth District, both approaches indicate that Oklahoma and Wyoming entered downturns in early to mid-2015. The second approach suggests Kansas and New Mexico entered recessions beginning in late summer 2016. On average, recessions in energy-producing states occur more frequently but are typically shorter than recessions in non-energy-producing states.
Comparing two methods of business-cycle dating
The B-B and Markov regime-switching methods identify many of the same recessions, though the exact dates of the turning points can differ by a few months. Chart 1 illustrates the business cycles identified for each state in the Tenth District under both methods. The shaded regions denote recessionary periods identified by the B-B algorithm, the blue line shows the state-level coincident index, and the black line shows the probability of recession from the Markov regime-switching model. A reading above 0.5 indicates the low-growth regime consistent with a recessionary period. The panels in Chart 1 show that, generally, the Markov regime-switching model identifies the same recessions as the B-B method. For example, the black line in Panel A borders the recessions identified by the blue shading, suggesting that both methods identified recessions in Colorado in 1981–82, 1985–86, 2001, and 2008–09.
Chart 1. Business Cycles of Tenth District States

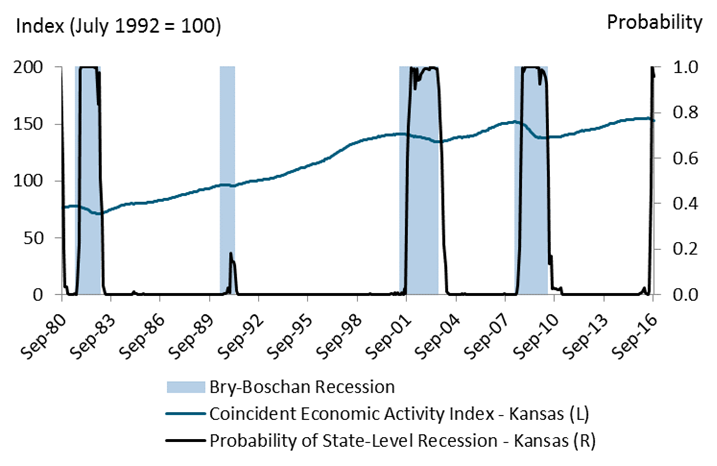

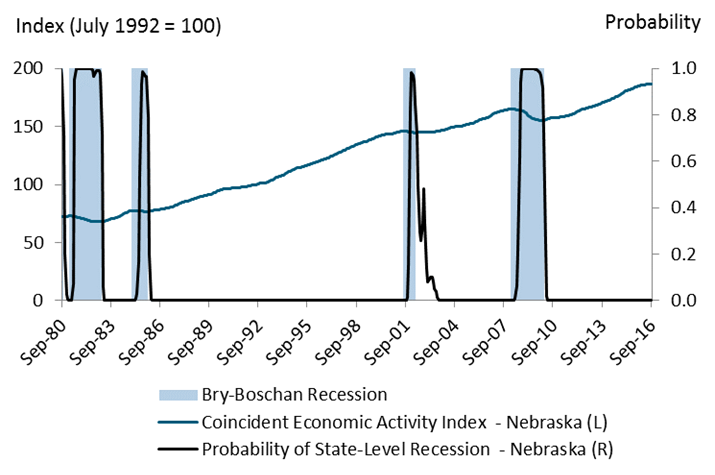
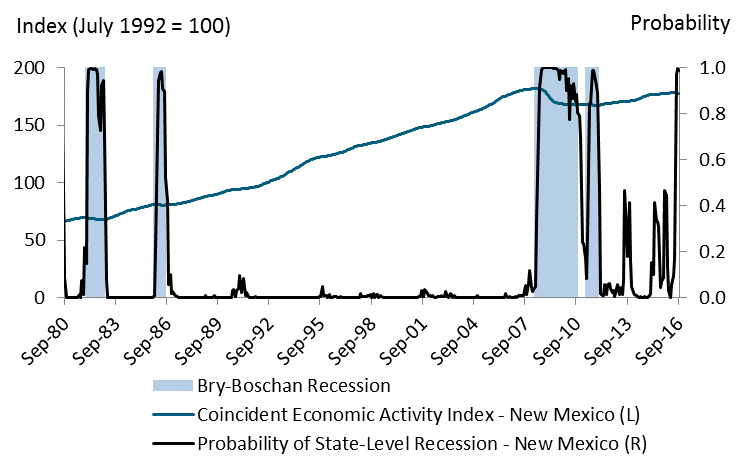
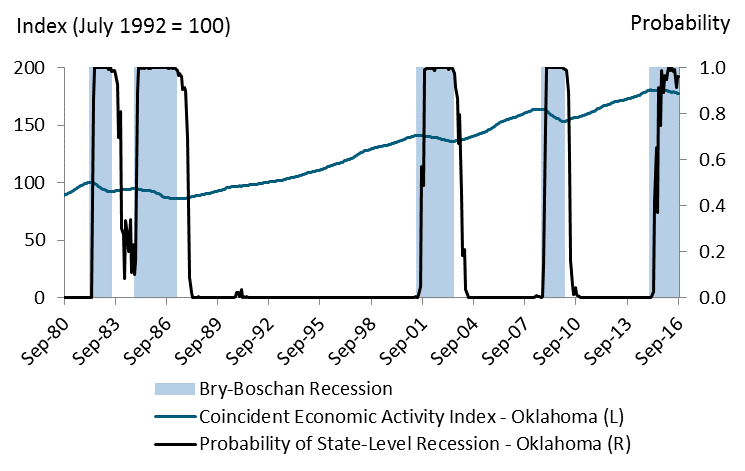
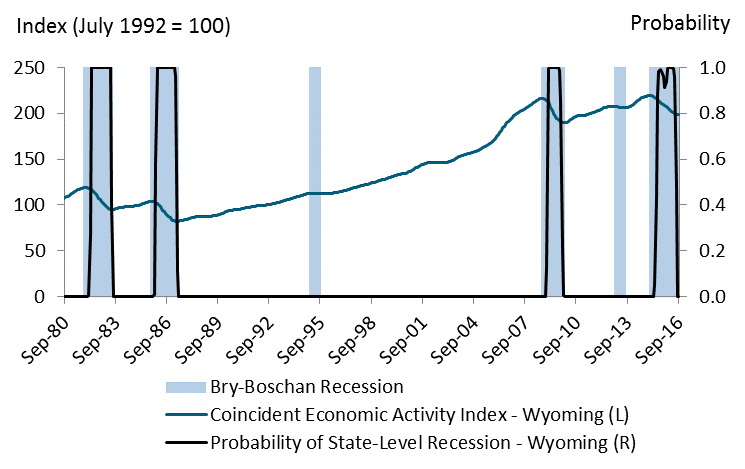
In addition, only the Markov regime-switching model identified the start of recessions in early to mid-2016 in Kansas (second figure in Chart 1) and New Mexico (fifth figure). While there could be numerous causal factors for recent state recessions, changes in oil prices are likely a main driver. Over the past couple of years, the price of oil fell substantially mostly due to changes in expectations of future oil demand relative to available supply (Davig and others). Oil price declines are a plausible explanation for recent recessions in New Mexico, Oklahoma, and Wyoming (given their relative dependence on the oil and gas sector) and may be a contributing factor in Kansas as well. As of September 2016, Kansas, New Mexico, and Oklahoma still appeared to be in recession, with Wyoming possibly exiting in the prior months. It is worth noting, however, that the most recent readings of the coincident index can be subject to (generally small) revisions.
References
Bry, Gerhard, and Charlotte Boschan. 1971. “Programmed Selection of Cyclical Turning Points,” in Gerhard Bry and Charlotte Boschan, eds. Cyclical Analysis of Time Series: Selected Procedures and Computer Programs, pp. 7–63. National Bureau of Economic Research. Available at http://www.nber.org/chapters/c2148.pdf.
Davig, Troy, Nida Çakır Melek, Jun Nie, A. Lee Smith, and Didem Tüzemen. 2015. “Evaluating a Year of Oil Price Volatility.” Federal Reserve Bank of Kansas City, Economic Review, vol. 100, no. 3, pp. 5–30. Available at https://www.kansascityfed.org/~/media/files/publicat/econrev/econrevarchive/2015/3q15davigetal.pdf.
Hamilton, James D. 1989. “A New Approach to the Economic Analysis of Nonstationary Time Series and the Business Cycle.” Econometrica, vol. 57, no. 2, pp. 357–384. Available at https://doi.org/10.2307/1912559.
This post written by Jason Brown.
Oil states in recession. No surprise. This will turn around in 2017.
Steven,
There is an article in this month’s ‘Atlantic’ which includes a claim that the break-even price for fracking has fallen from $69 to $29 a barrel over the last several years. The average drilling time down from 25 days to 15, and etc.
So, yea, the oil states may be back in the game. A pipeline here, and a pipeline there, and the Royal Gulfies may need to play nice.
The Atlantic writes:
“In the Bakken shale formation in North Dakota and Montana, where the economics of fracking are particularly favorable, the average break-even price is $29.”
I find little evidence of this. I looked at Hess’s numbers last night, and their Bakken breakeven looks around $48 / barrel.
Indeed, Art Berman yesterday published an article entitled “The Beginning of the End for the Bakken Play” (https://www.forbes.com/sites/arthurberman/2017/03/01/the-beginning-of-the-end-for-the-bakken-shale-play/#722aec711487), arguing that the Bakken has peaked.
I think Art is over-stating the case. Lynn Helms, the Director of the North Dakota Department of Mineral Resources, wrote on Feb. 15 that “operators are shifting from running the minimum number of rigs to incremental increases throughout 2017, as long as oil prices remain between $50/barrel and $60/barrel WTI.”
We’ve seen very little recovery of drilling activity in the Bakken. Since the cyclical trough in May, the Bakken has added a total of 13 rigs (to 35). By contrast, the Permian has added 149 horizontal rigs.
In any event, the Permian looks like it works in the $43-48 / barrel WTI range. The Bakken fully loaded economic breakeven is probably closer to $60 WTI, largely because transportation costs knock about $10 / barrel off the price received by Bakken producers compared to those in the Permian.
Your larger point, however, may be correct. US horizontal oil rig counts have been rising about twice the target pace in the last several weeks. Should this trend continue, it will tend to put pressure on OPEC to ease the price back. Here’s my graph over at Calculated Risk.
http://www.calculatedriskblog.com/2017/02/oil-another-huge-week-for-total-us-oil.html
Steven,
Yea, good stuff. And mostly accurate, but…as someone who has worked on the Barnett, the Bakken, and the Eagle Ford, and as someone who has also owned land that was part of a unit ( I was also born in the Permian Basin where my father worked as a ‘roughneck’), I have something to add here that often gets overlooked.
First, the number of rigs added is a misleading figure because many wells that have already been drilled are not in production for a variety of reasons. On the Bakken for example there are ‘capped’ wells which are not in production because it was decided to wait for a price increase, or for connecting pipelines to be completed. So, naturally, it is much more about what the price does than anything else.
Second, I worked on the Barnett back when there weren’t enough rigs to meet the demand, and so many more wells could have been brought into production, much sooner, if there had been more rigs available. So, the fact that drilling now takes so much less time, and that there are so many more rigs available, could be a big factor if the price warrants a big push.
Third, those who truly know how much oil is actually there, below ground, benefit from the ‘belief’ that the supply is limited. So, it is wise to be skeptical of any such claims. A family friend, who truly knows, once told me that there is enough oil in the Permian Basin alone, to last the US another 100 years. It is heavy, and more costly to extract and to refine, but of course we now have the technology to bring it up.
Fourth, the petrodollar arrangement is a major factor in all of this.
I am having some of my comments vanish when I post.
There are so many measures of “economic health” that it is difficult to assess “real time” conditions in a state. If a state has high unemployment, but recent increases in employment, does that constitute a “healthy” economy? If a state has exceedingly low unemployment, but business flattens or slightly decreases from a prior year, does that constitute a “recession”?
Here is a slightly different perspective: https://www.conference-board.org/data/helpwantedonline.cfm Labor supply/demand is not a perfect indicator or how well an economy is doing, but it’s a good one.
Bruce Hall: This paper addresses a narrower question: Is a particular economy expanding or contracting. That conforms to a definition of expansion or contraction, which is commonly used — for better or for worse — in business cycle analysis (as opposed to rhetoric/polemics).
Yes, Menzie, I recognize that. But the term “recession”, while specific, is ambiguous in the sense that that really doesn’t portray equal situations. That was my only point. A state may have a fall off (recession) from a very high level of economic activity (North Dakota) and still have an extremely healthy economy while another state may be experiencing “growth” from a very messy situation and still not be healthy from a reasonable perspective.
I don’t think we are arguing.
Bruce Hall: From NBER (who developed the concept of recession/expansion):
bruce, the problem with keeping the definition ambiguous, as you seem to promote, is it allows individuals to pass judgement or opinion on performance without strong metrics for comparison. one could be in the position to condemn a slow recovery from a deep downturn, or promote a decline from a bubble, depending upon their political whims. it allows one to promote their view of good or bad, without really taking into account the major feature of a recession: drop in economic activity. there really is nothing positive about a drop in economic activity, and we should not allow what should be well defined definitions to become ambiguous so that one can argue the drop in economic activity is a positive result.
Baffling,
Call this the Paradox of Political Whims if you like, but without ‘weak’ “metrics for comparison” the resulting downturn in recession spin would almost certainly cause so much job loss that a recession could follow. Not a Great Recession maybe, but a recession caused by too little discussion about recessions.
Okay, Menzie and baffling, you win on a technicality. It is important to know when economic activity is slowing down. I agree completely.
But, taken two states of relatively the same size economy, there are differences that either reduce or accentuate what a recession actually means. Some states have a significant “rainy day fund”, low unemployment, low debt, a highly educated populace, and an overall cost structure that provides a cushion. That, perhaps, is why when some states are technically in a recession, there is still a reasonably good demand for labor. Some states in a growth or expansion period may have an opposite profile.
That is what I meant when writing that the term “recession” is ambiguous. Technically, there is no ambiguity; contextually there is. It’s the “I know I’m doing great, but why do I feel so bad” syndrome.
http://www.mckinsey.com/~/media/McKinsey/Industries/Public%20Sector/Our%20Insights/Measuring%20the%20state%20of%20US%20states/Measuring-the-state-of-US-states.ashx See page 3.
bruce, i think you are alluding to the rate of change and duration of the drop. but both are measured by economic activity. you seem to want a real time measure or explanation of the changes-which i understand. but in order to obtain such an explanation, you have to make some assumptions on current and past performance as predictors for future performance. and it is those such assumptions that can be politicized. scientists like firm data, such as gdp and the criteria for what constitutes a recession. the concept of a “healthy” economy is more of a pundits world, where the facts are up for opinion. it may be great for conversation, but terrible for policy and decision making. it is the reason why people on this board argue.
Since the topic is about projecting recessions, I’ll just offer this a̲n̲c̲i̲l̲l̲a̲r̲y data: https://www.mercatus.org/publication/weathering-next-recession-how-prepared-are-50-states
http://www.taxpolicycenter.org/taxvox/next-recession-are-states-ready