Not spectacular.
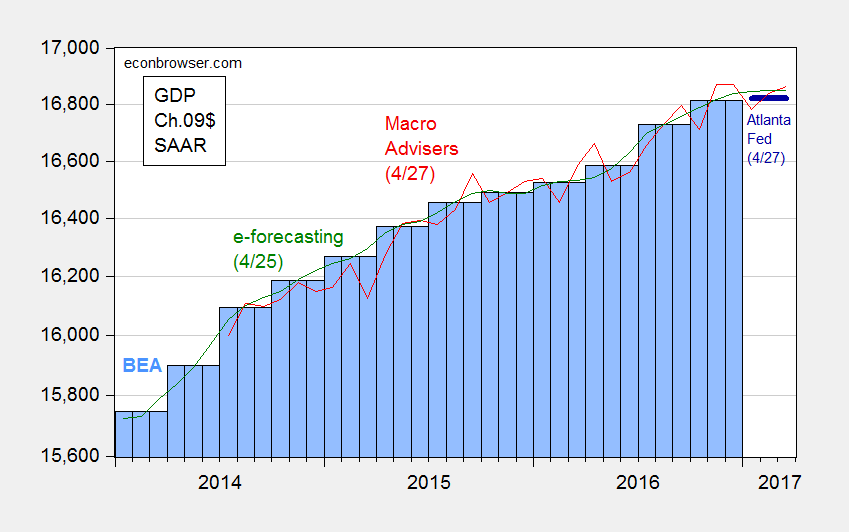
Figure 1: GDP in billions Ch.2009$ SAAR, from BEA (3rd release) (blue bars), from Atlanta Fed GDPNow (4/27) (dark bold blue line), Macroeconomic Advisers (4/27) (red line), and e-forecasting (4/25) (green line), all on log scale. Atlanta Fed level calculated applying q/q SAAR growth rate to 2016Q4 level. Source: BEA 2016Q4 3rd release, Atlanta Fed, Macroeconomic Advisers, e-forecasting, and author’s calculations.
In contrast, Bloomberg consensus is for 1.1% q/q SAAR growth in 2017Q1.
Update, 4/28, 10:30AM Pacific: Here is a graph updated to include the advance BEA data on GDP. For additional discussion of the implications, see Jim’s post.
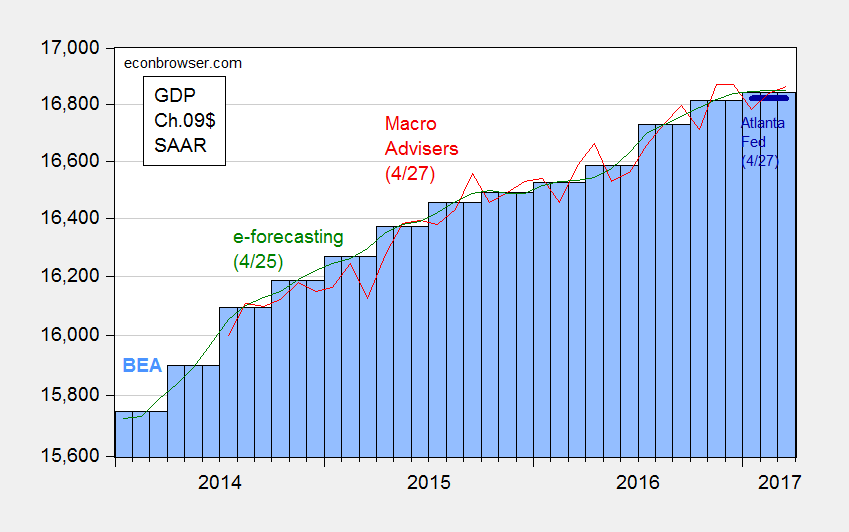
Figure 2: GDP in billions Ch.2009$ SAAR, from BEA (Q1 advance release) (blue bars), from Atlanta Fed GDPNow (4/27) (dark bold blue line), Macroeconomic Advisers (4/27) (red line), and e-forecasting (4/25) (green line), all on log scale. Atlanta Fed level calculated applying q/q SAAR growth rate to 2016Q4 level. Source: BEA 2017Q1 advance release, Atlanta Fed, Macroeconomic Advisers, e-forecasting, and author’s calculations.
Professor Chinn,
Am I reading correctly from the New York Fed and the Atlanta Fed “now casting” websites, that each group forecasts 1Q2017 SAAR at 2.7% and 0.2% respectively? If so, wow, quite a difference.
AS: Yes, it is quite a difference. Jim has a post on the subject of why they differ.
0.7% GDP. Bad.
However, if you look at Q1 borrowing — which collapsed — this was not a surprise. I personally would not at all be surprised to see something like a weak, technical recession here in the next quarter or two, very small GDP declines to very small advances.
Welcome to the Trump Recession.