Steve Kopits obsesses on the household survey based employment series for Wisconsin, despite our previous exchange on why reliance on this series for Kansas is a problem. But just to make matters concrete, lets look at a few vintages of the household series.
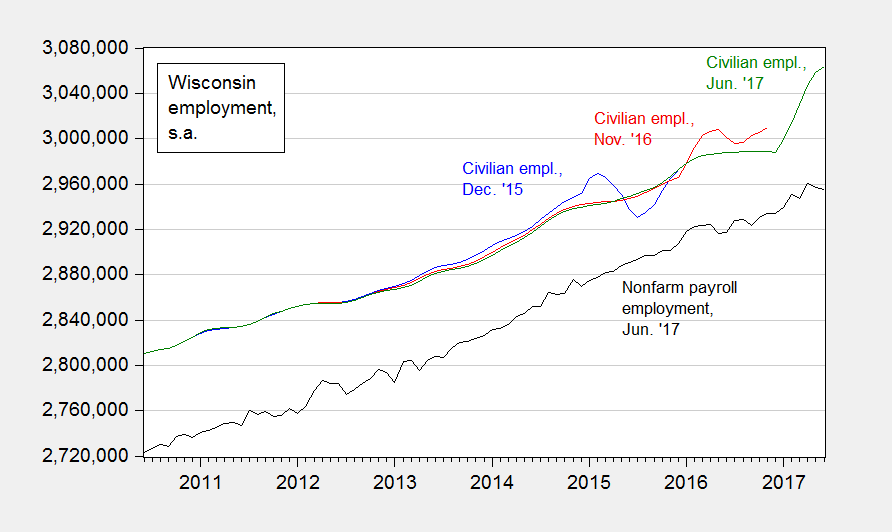
Figure 1: Civilian employment from HOUSEHOLD survey in Wisconsin, from December 2015 release (blue), November 2016 release (red), June 2017 release (green), and nonfarm payroll employment from ESTABLISHMENT survey June 2017 release (black), all seasonally adjusted. Source: BLS.
As can be seen, there is wide variation in the estimated civilian employment over the various releases. The establishment series exhibits much less variation over releases at the state level, particularly smaller states. The reasons why this is true was discussed by Justin Wolfers, with special reference to unemployment rates.
Bottom line: Know your data.
I argued that you are taking the position that the civilian employment series is grossly misstating the case and that the actual number must be dreadful. I felt this a strong statement; however, if you have an error correction model for the series you’d like to share and a forecast for the current actual, hey, let’s see it. Otherwise, to pick on Wisconsin is like picking on the A- student in class for his under-performance. Sure, you could. But I’d be more interested in how the A+ students got there (Colorado, Nebraska, NH and Pence’s Indiana); how the D-/F students got there (Illinois, New Jersey, PA, CT); and the key movers up or down (notably Texas, down).
Steve Kopits: I don’t think I’d estimate an error correction model, given that’s for predicting k-step ahead. Regression by way of related series might be the way to go.
Chose a method, give a number.
Japan’s Lost Century
And if we’re talking about my obsessions, why don’t you publish the Japan paper. It’s a basic analysis combining IMF GDP data with Japanese national population statistics and forecasts. I found it incredibly helpful in understanding the interplay among demographics, GDP growth and fiscal policy in Japan in the 2000-2050 time frame.
For me, this article is a must read. I think your readers would also find it of interest and worth discussing.
As published in the National Interest:
http://nationalinterest.org/feature/japans-demographic-crisis-will-only-get-worse-heres-why-21594
And with graphs, on my own blog:
http://www.prienga.com/blog/2017/7/20/japans-lost-century
It’s also in your inbox.
You see Noonan on Trump? Savage. Maureen Dowd or Charles Blow would be kinder.
https://www.wsj.com/articles/trump-is-woody-allen-without-the-humor-1501193193