And lags further behind its neighbor Minnesota. Wisconsin nonfarm payroll (NFP) employment is now below April 2017 peak. Finally, employment lags what would be predicted from the historical correlation of Wisconsin employment with national.
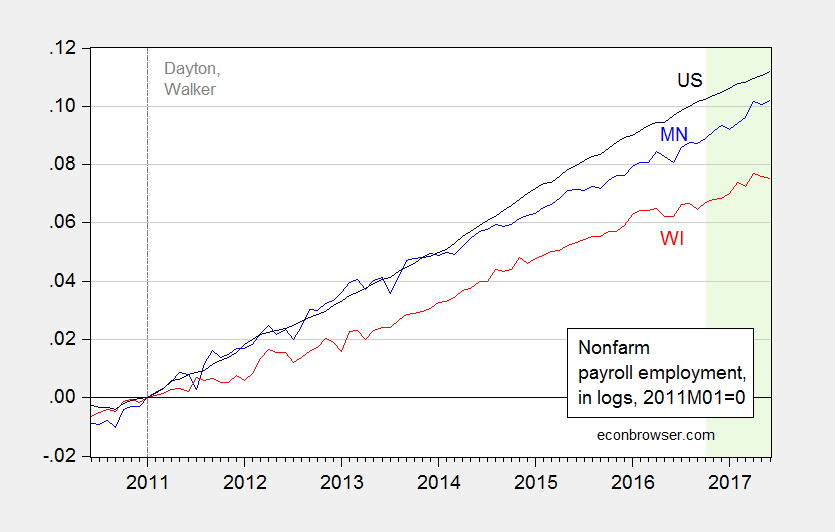
Figure 1: Nonfarm payroll employment in Minnesota (blue), Wisconsin (red), and US (black), all in logs normalized to 2011M01=0. The light green shaded period pertains to data that has not yet been benchmarked using QCEW data. Source: BLS and author’s calculations.
Of course, what is relevant is the counterfactual. If I use the historical correlation between national and Wisconsin nonfarm payroll employment over the 1990-2010 period, and then (using a bivariate error correction model, with 1 lag, assuming US employment weakly exogenous) dynamically forecast the expected level of employment, I find that Wisconsin lags what should be expected, by a statistically significant amount (90% confidence level). This is shown in Figure 2.
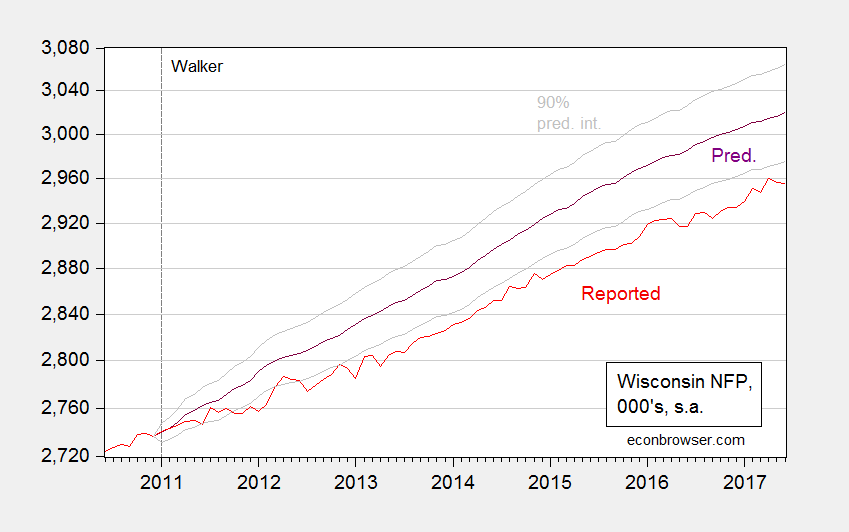
Figure 2: Wisconsin nonfarm payroll employment as reported (red), dynamic ex post simulation using error correction model (purple), 90% prediction interval (gray). Plotted on log scale. Source: BLS, and author’s calculations (see text).
Note that the long run implied elasticity between Wisconsin and US employment is 0.71, so I already account for the fact that Wisconsin employment has historically been growing slower than US employment. The fact that reported Wisconsin NFP employment is lower than predicted for the post-2010 period can either be attributed to a sudden demographic shift that occurred at the same time that Governor Walker took office (possible, but I don’t know what that shift was), other factors omitted from the statistical analysis, or to the regulatory and fiscal policies implemented at roughly the same time as the Walker administration began.
From the 21 July press release, citing 12 month changes:
“Today’s data indicates that Governor Walker’s efforts to connect workers to employment and provide businesses with an economic climate conducive to continued growth are working,” Secretary Allen said. “At DWD, we will continue our efforts to connect jobs seekers to not only jobs, but family supporting careers.”
That press release was a master piece in cherry picked data. My favorite lie (cough – I meant line):
Wisconsin added 7,900 manufacturing jobs year over year, ranking 4th highest nationally in the number of manufacturing jobs added.
Wisconsin personal income growth dramatically outperformed Minnesota in Q1.
https://bea.gov/newsreleases/regional/spi/SQPI_NewsRelease.htm
Uhhh, okay. That’s got nothing to do with non-farm payroll.
Change in Total Non-Farm Employment, June, YoY:
US: + 1.6%
Wisconsin: +1.3%
Change in total employment, Wisconsin: 2.6%
Unemployment rate
US: 4.4%
Wisconsin: 3.1%
Steven Kopits: You do know state level Household survey based data are measured with large degrees of error? Our previous discussion was here.
And yet those household numbers suggest employment is just rocketing up. So to pick out Wisconsin, 8th in the nation with a 3.1% unemployment rate — which has fallen much faster than Minnesota’s — as some kind of failed state seems peculiar to me.
Let’s see some fiscal outlook on Connecticut, NJ, PA, or Illinois. These are states facing really difficult decisions of considerable importance both internally and nationally.
To wit:
https://mishtalk.com/2017/07/25/tracking-the-great-escape-from-cook-county-and-illinois/
Hey Steve- Where’s Kansas, (who has lost more jobs than any state in the nation the last 12 months) in that analysis?
Add in Oklahoma, Louisiana, New Mexico and Mississippi as well while you’re at it. All great examples of GOP “governance” in the 2010s.
Jake –
Did I defend fiscal policy in Kansas? I do not believe I did.
As for the states,
Illinois: Rep gov; Dem legislature
PA: Dem gov, Rep legis
NJ: Rep Gov, Dem legis
CT: Dem gov, Dem legis
I am more interested in policy than politics.
Steve’s more interested in a post-fact universe where failed fiscal policy works.
https://data.bls.gov/timeseries/LASST550000000000006?amp%253bdata_tool=XGtable&output_view=data&include_graphs=true
https://data.bls.gov/timeseries/SMS55000000000000001?amp%253bdata_tool=XGtable&output_view=data&include_graphs=true
As with Kansas, compare 2007 (previous approximate peak) with 2017. Maybe the graphs are misleading.
Maybe the 3.1% U3
Computer hickup on last comment….
Maybe the 3.1% U3 versus U.S. total of 4.4% isn’t good enough… despite historical variance of around 0.9-1.0%. Need to lower than to, what, 2.2%?