As I was compiling background notes for the new semester, I found the current level and trend in the term spread of interest.
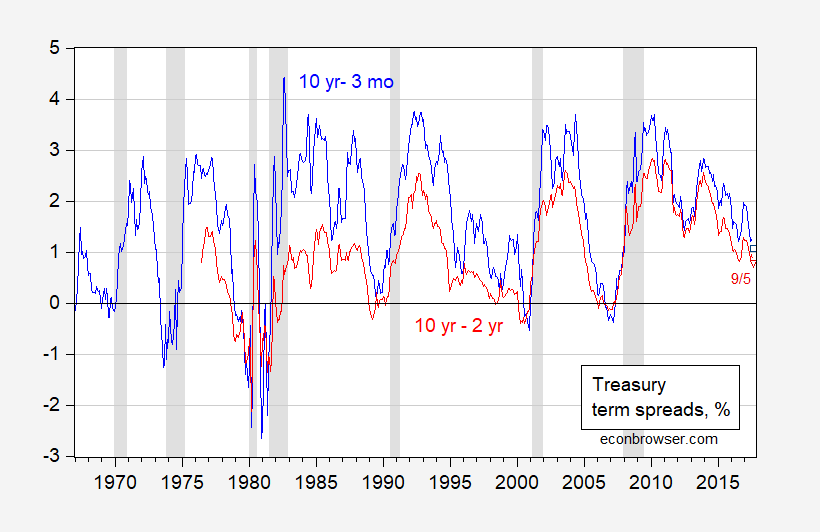
Figure 1: Ten year minus three month Treasury spread (blue), and ten year minus two year spread (red), %. Observations for September are 9/5. NBER defined recession dates shaded gray. Source: FRED, Bloomberg, NBER and author’s calculations.
Run the probit regression
recessiont+6 = -0.81 -0.474×(GS10-TB3MS)t + 0.065×TB3MSt + ut
over the 1967M01-2017M02 period (McFadden R2 = 0.24); the implied probability of recession is 10% for February 2018.
Using a specification without the level of the short rate included leads to a slightly higher probability, 14% or so.
The detail is also interesting. The spreads are smaller than they were in October 2016.
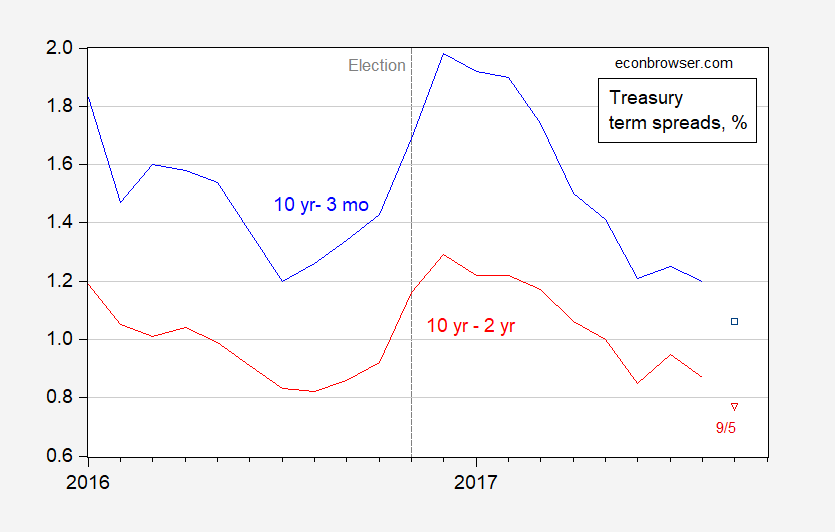
Figure 2: Ten year minus three month Treasury spread (blue), and ten year minus two year spread (red), %. Observations for September are 9/5. Source: FRED, Bloomberg, and author’s calculations.
Puts you a year out from a recession.
And this is good news, right?
Professor Chinn,
Would you link your data. My results are a bit different. I get: usrecm(+6) = -0.92 -0.444x(GS10-TB3MS) +0.077xTB3MS. I’d like to see how I could go wrong,
Thanks
The 10-year U.S. Treasury bond yield remains in a long-term downtrend:
https://stockcharts.com/h-sc/ui?s=%24TNX&p=M&st=1992-01-01&en=today&id=p33476771333&a=155975373&r=1504800675150&cmd=print
makes one wonder if it is reasonable to expect recent growth to return to historical norms when we have had 20 years of downturn in bond yields.
It seems like negative spread is correlated to recession. But a trend down doesn’t mean, we will go negative. Could reverse as in 1996.
I would be very wary of expecting trends to continue. It smacks of the “momentum” analogy for stock prices (technical trader stock fallacy). Not accusing you, but beware.
[And the time from going negative to the recession is so fast, that I wonder if even that is helpful predictively (as tradeable information), after all there are lots of signs of recessions in orders, inventory, consumer confidents etc. that happen faster than the official logged recession. This can happen because stopping some sorts of growth can have a lag from planning cycles, contract terms, etc.]
Depends on which regime you think we’re in.
Krugman:
“On one side, an aging population means fewer workers paying taxes to support Social Security and Medicare. Demography is the main reason long-run forecasts suggest problems for Social Security, and an important reason for concerns about Medicare. Driving out young workers who will pay into the system for many decades is a way to make these problems worse.
“On the other side, declining growth in the working-age population reduces the returns to private investment, increasing the risk of prolonged slumps like the one that followed the 2008 financial crisis.
It’s not an accident that Japan, which has low fertility and is deeply hostile to immigration, began experiencing persistent deflation and stagnation a decade before the rest of the world.”
https://www.nytimes.com/2017/09/08/opinion/dreamers-liars-and-bad-economics.html
Goldman Sachs (in an otherwise unfindable report)
“The combination of low unemployment and low inflation has led many market participants to search for disinflationary structural forces that might be at work. Today’s note explores one often-cited explanation: demographics.
“Demographic trends could influence inflation via their impact on growth, the dependency ratio, or inflation expectations. Other researchers have found that faster population growth is associated with higher inflation in cross-country studies; using US city data, we find a very small positive effect that arises only via the shelter component. Researchers have found mixed results on the effect of the dependency ratio, and we do not find a statistically significant effect.
“Overall, our results imply a small and very gradual drag from demographics of about 0.05pp relative to the effect in 1980. While demographic effects via lower inflation expectations are intriguing and more difficult to test, any such effect would be very gradual and—with the expectations of all age groups still above 2%—not inconsistent with returning inflation to target.”
Read more at http://www.calculatedriskblog.com/#V7aClgCwouwEKYbS.99
But maybe the Great Recession ends and productivity perks up.
Bloomberg:
“It’s taken ages to get to this hard-won acceleration in productivity growth, which is perhaps why the experts are wary of diagnosing it, or are missing it altogether.
…
“But productivity growth remained sluggish.”
“Now, perhaps, that’s changing too. Accelerating growth with stable or falling inflation and employment implies that productivity growth is increasing, allowing the economy to do more with less. Companies that want to hire but can’t find workers are simply forced to innovate and invest in labor-saving resources.
“There’s evidence of this productivity shift within the labor market. Since March, total employment has grown by 907,000 jobs. Of that, employment in the “goods-producing” sector — think higher-paid, higher-productivity industries like construction and manufacturing — and the “professional and business services” industry — think knowledge workers — has grown by 397,000 jobs. Lower-paid, lower-productivity industries like in the retail and leisure and hospitality industries have grown by only 174,000 jobs.”
https://www.bloomberg.com/view/articles/2017-09-07/don-t-look-now-but-productivity-is-finally-rising
Menzie : Are all the variables implicitly expressed as natural logs?
recessiont+6 = -0.81 -0.474×(GS10-TB3MS)t + 0.065×TB3MSt + ut
Erik Poole: No; recession is binary, GS10 and TB3MS in percent.