Where do we stand?
Here’s the official GDP series and two monthly series.
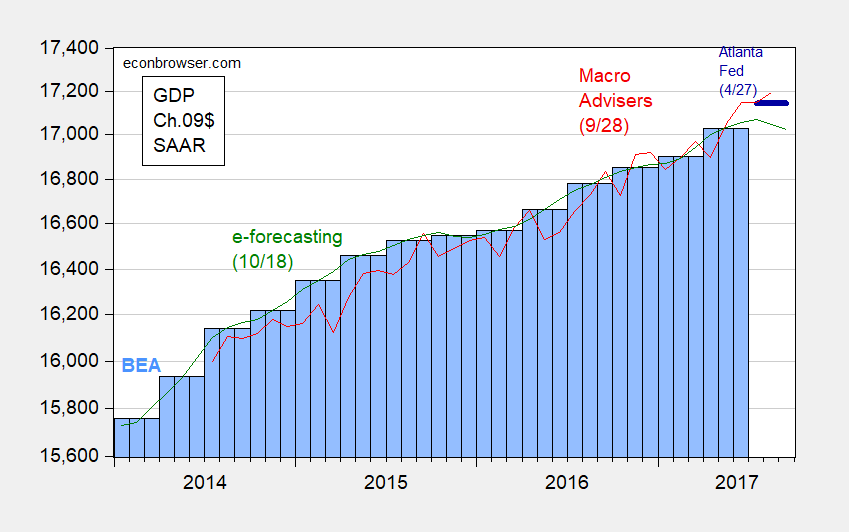
Figure 1: Real GDP in bn. Ch2009$ SAAR, from third release (blue bar), Macroeconomic Advisers (green), e-forecasting (red), GDPNow (dark blue bold line). Source: BEA, Macroeconomic Advisers (28 September), e-forecasting (18 October), Atlanta Fed GDPNow (13 October).
Note that the decline in monthly GDP as calculated by e-forecasting starts in August, before Hurricanes Irma and Harvey. Of course, these monthly series are subject to large revisions, so it’s advisable to downweight such a movement. In addition, the Atlanta Fed’s GDPNow suggests continued growth in the third quarter, 3% SAAR.
Five key indicators the NBER Business Cycle Dating Committee (BCDC) have in the past examined are depicted below. They also indicate continued growth (keeping in mind distortions in the September nonfarm payroll employment number due to the impact of the hurricanes).
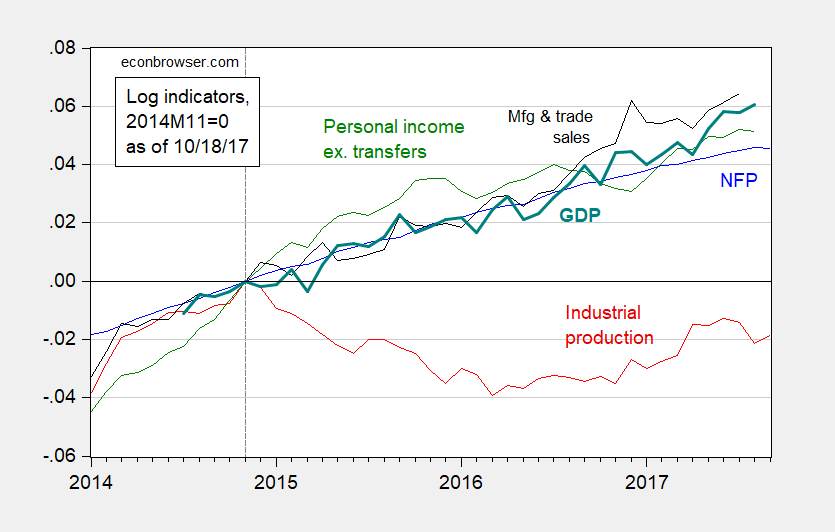
Figure 2: Log nonfarm payroll employment (blue), industrial production (red), personal income excluding transfers, in Ch.2009$ (green), manufacturing and trade sales, in Ch.2009$ (black), and monthly GDP, in Ch.2009$ (bold teal), all normalized to 2014M11=0. Source: BLS, Federal Reserve, BEA, and Macroeconomic Advisers (28 October release), and author’s calculations.
All these series continue to rise, although industrial production is still below the recent peak. The fact that manufacturing production is still only 0.3% above 2014M11 levels is troubling, and might reflect the lagged effects of the strong dollar. Still, this pattern of one lagging indicator while others rise (taking into account the hurricane impact on September employment) is not the same as what occurred in 2008 (see discussion here). Hence, the current situation does not appear consistent with an ongoing recession, as of August/September.
Looking forward, the 10 year-3 month spread (constant maturity) as of 10/17 remains positive at 1.20%, so no inversion has occurred. However, this figure is below the 1.42% spread recorded on November 7th — the day before the election — , and far below the 2.09% on 12/16; these figures are consistent with a deceleration of growth relative to that expected at the end of last year.