From CNBC yesterday:
A government jobs report, like the one for March, that’s so out of whack compared to expectations usually sparks admonishments from market watchers not to make too much out of any single monthly data set.
But leading labor economist Ed Lazear said Monday that this time is different. “The reason I pay a little bit more attention to this one, it’s not just one month, it’s a series of indicators—almost all of which—are pointing in the same direction.”
I wondered what indicators Professor Lazear was speaking of. Instead of downloading a whole set, I retrieved from FRED four key indicators cited by the NBER BCDC in dating the 2001 recession (the set is larger in recent trough dating, see here), available as of 4/7.
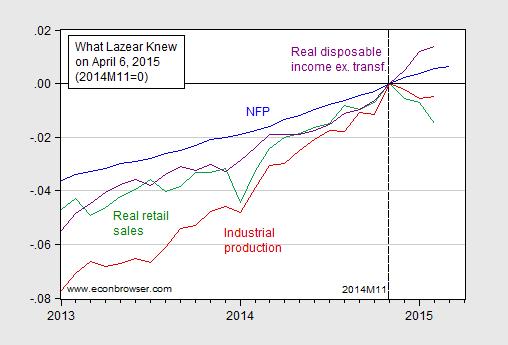
Figure 1: Log nonfarm payroll employment (blue), industrial production (red), real retail sales (green) and real personal income ex.-transfers (purple), all normalized to 2014M11 = 0. Source: BLS, Federal Reserve Board, St. Louis Fed, and BEA via FRED, and author’s calculations.
NFP and real disposable income continue to rise, while industrial production and real retail sales have declined in recent months. Now if one is worried by this picture (and I am slightly), one should’ve been very worried by this one (first included in this post).
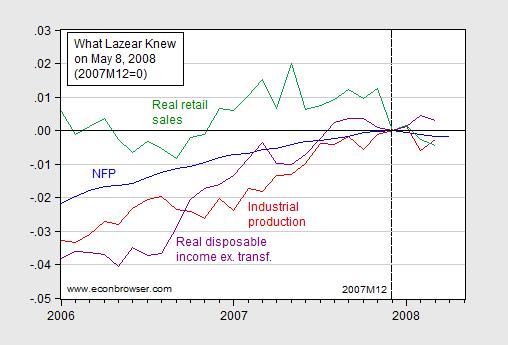
Figure 2: Log nonfarm payroll employment (blue), industrial production (red), real retail sales (green), and real disposable income excluding transfers (purple), all normalized to zero at 2007M12; data available as of May 8, 2008. Source: St. Louis Fed ALFRED database, and author’s calculations.
And yet, knowing these data, Professor Lazear, in his capacity as CEA Chair stated on May 8th, in somewhat less circumspect terms:
“The data are pretty clear that we are not in a recession.”
(This is a quote from a WSJ article entitled “Lazear Sees No Recession for U.S. Economy”.)
Additional data on overall economic activity is shown in Figure 3.
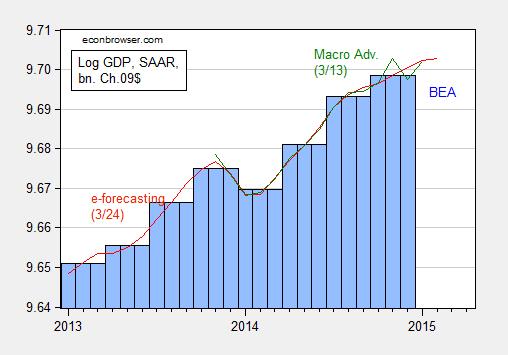
Figure 3: Log GDP from BEA (blue bar), and from e-forecasting on 3/24 (red), and from Macroeconomic Advisers on 3/13 (green), all in bn. Ch.2009$ SAAR. Source: BEA 2014Q4 3rd release, e-forecasting, Macroeconomic Advisers, and author’s calculations.
The NBER BCDC refers to GDP and the Macroeconomic Advisers monthly series in dating peaks and troughs. Those indicators seem to point against a downturn (but, recalling the cautionary tale of Don Luskin, I won’t say a downturn is impossible!).
If one were worried about recession, then one illuminating time series is the behavior of the term spread, which as I have recently noted has some predictive power for future growth, as well as recessions (based on Chinn and Kucko, 2015).
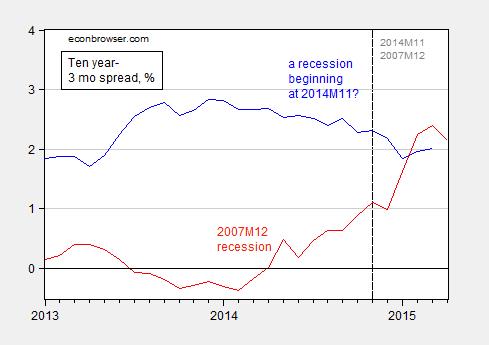
Figure 4: Ten year minus three month Treasury spread (blue), and normalized to the 2007M12 recession (red), in %. Source: FRED and author’s calculations.
The ten year-3 month spread went negative in August 2006, 16 months before the recession’s beginning (according to NBER). The ten year-3 month spread has not yet inverted (and using the shadow Fed funds rate would make the spread larger, not smaller).
On one point, Professor Lazear and I agree — it is too early for the Fed to start increasing the policy rate.
Update, 4/8 3:10PM Pacific: As Spencer notes, there is a series on sales (manufacturing and trade sales) that is actually used by NBER BCDC in dating turning points. Here is a reprise of Figure 1, replacing the retail sales series with the manufacturing and trade sales (I can’t redo Figure 2, as I don’t have a correct vintage of the series).

Figure 5: Log nonfarm payroll employment (blue), industrial production (red), real manufacturing and trade sales (green) and real personal income ex.-transfers (purple), all normalized to 2014M11 = 0. Source: BLS, Federal Reserve Board, St. Louis Fed, and BEA via FRED, and author’s calculations.
What if you took Figure 1 and changed real retail sales to real retail sales less gasoline? It shouldn’t look nearly so ominous.
Menzie,
Why do you criticize Lazear for saying we are not in a recession? Do you actually believe we are in one?
Lazear seems to clearly say that we are not in much of a recovery and based on the data he is right. We are simply bumping along the bottom of the economy waiting for the someone in government to stop killing production and distorting market signals.
By the way in true Keynesian form you discount indicators of goods and services while highlighting increases caused by government largess. Without increased production of real life-sustaining goods and services, production of more money doesn’t mean much. No matter what spice you use, eating money is not a source of nutrition.
Example of government destruction of economic recovery. The destruction of income of graduates due to predatory government student loans.
While our federal government continues to chase many mortgage lenders for so-called “predatory lending” practices, perhaps we should check in on the situation of far and away the biggest predatory lender of all, the federal government itself. Its most odious practices are in the area of student loans. I find the term “predatory” a stretch when applied to a mortgage loan for a house, given that in the worst case the borrower got to live in the house, and even if he gets foreclosed and has a deficiency balance he can normally discharge that in bankruptcy. Not a pleasant process, but sometimes life can be tough. Compare that to federal student loans, where the government lends inexperienced 18 – 24 year-olds open-ended amounts, often for dubious and overpriced trade schools, and then flatly forbids discharge in bankruptcy. Many borrowers’ finances are ruined for life, and they don’t even have marketable job skills to show for it. Now that’s predatory! Francis Menton
ricardo,
your quote on student loans is half right. overpriced trade schools certainly should not have access to subsidized loans. these schools form the overwhelming majority of problem loans in the country today. we have seen for profit educators are not good stewards of the education system. and i agree with the bankruptcy discharge issue related to student loans. the idea of a debtor prison, which is what they effectively create, is not very appealing.
It’s not just for-profit schools. We have to stop giving non-profits a pass simply because they don’t have equity owners. SOMEONE is profiting… It’s more than likely that non-profits cause more damage since more people attend them and graduate with debt and are unemployed.
anonymous, the data seems to indicate the biggest problem is with the for profit enterprises. if you can show the data to illustrate a significant problem in the non profit sector, please do so. but the for profit schools basically lied to the students about post graduate job prospects. non profit schools in the liberal arts did not do that-people were fully aware of the employment potential for most degrees offered.
You’re seriously out of touch with reality.
summary of student loan values at graduation (note nonprofit accumulates over 4 years, for profit accumulates a larger value over shorter time period as well)
http://ticas.org/sites/default/files/pub_files/Debt_Facts_and_Sources.pdf
http://ticas.org/sites/default/files/legacy/pub_files/CDR_2014_NR.pdf
anonymous, perhaps these will lead you back to reality? if you do not see a problem with for profit enterprises you are not looking at the data.
Taking away non-profit status from tax-exempt foundations like Rockefeller, Carnegie, and Ford should be an overriding priority of Congress. Not only do their equity assets grow exponentially faster than those of taxable mutual funds that manage IRA and 401K savings of ordinary Americans, their longstanding interlocking agenda is antithetical to what America stands for. They stonewalled the Reece Commission to hide the fact that their primary goals are opposite to their stated purpose. Read Wormser, Foundations: Their Power and Influence. Read Iserbyt, The Deliberate Dumbing Down of America. The latter is the virtually unknown story of how and why the US public school system is in deliberate planned free-fall. Free pdf on the internet. All America should have their eyes opened to the shocking activity of these behemoths.
Perhaps, Lazear was optimistic in May 2008, given the timely Bush stimulus plan passed earlier in the year and didn’t completely work its way through the economy. Real GDP growth was positive in 2008, until Lehman failed in September.
Here we are six years into the expansion, since June 2009, and monetary policy is still in emergency mode. We seem constrained to deal with another recession, particularly after increasing federal debt by one-third, since 2008.
I think we were in for a balance sheet recession, regardless of what happened with Lehman. As for the ‘who coulda knowed’ crowd, I was shorting the DOW at the time based upon this very notion. (Although I started my shorts too early, I was able to avoid Keynes’ observation that markets can stay stupid a lot longer than the rational can stay solvent betting against them.)
You are using the FRED estimate of real retail sales that deflates sales by the CPI.
That is a very poor series that consistently understates real retail sales.
There is a little known unpublished series on real retail sales that BEA calculates when they calculate consumer spending.
It provides detailed sector deflator for the various categories of retail sales. Over the long run the retail deflator shows that retail inflation averages a whole percentage point lower than the CPI reports. That is largely because retail sales do not include housing and education.
Right now there is a massive difference between the retail deflator and the CPI as the y/y % of the deflator is minus -3% while the CPI is minus -0.07%.
The 3 month rate of retail prices was -12.& (SAAR) in January and – 8.8% (SAAR) in February.
Consequently the BEA is reporting that the y/y change in real retail sales is 6%, the strongest it has been since the 1990s.
You can find the data here:
http://www.bea.gov/iTable/iTable.cfm?reqid=12&step=1&acrdn=1#reqid=12&step=1&isuri=1
This is a real bugaboo of mine that good economists and journalist ignore this far superior data series on real retail sales just because it is not accompanied by a press release and not part of the Wall Street’s suckers game of guessing monthly data releases. All the game does is increase
stock and bond market trading and volatility — brokerage house profits are highly dependent on market volume.
That should be -12.7% for January.
Spencer: The RRSFS series in FRED is highly volatile (as shown in both Figures 1 and 2). I’ll see if I can show recent evolution of manufacturing and trade sales, which is listed by NBER BCDC as the exact sales series.
The second difference of real manufacturing and trade sales just turned positive.
In Feb the Y/Y Ch; was 5.4% vs 2.8% in December.
Employment and personal income all makes sense.
Industrial production could be down due to strong dollar, weak oil patch.
Retail sales are somewhat baffling, but could conceivably be related to West Coast port strikes, ie, it could be a supply, not demand, problem.
I have been looking at monthly state revenue reports for sales taxes.
These have only been reported through February, and that report is mainly January sales (the taxes on which are paid the next month).
So far the data points to the weather. TX (oil) and CA (ports) had strong sales tax reports in February. NY had not just a negative report, but sales taxes were actually negative YoY as well! You may recall NYC shut down its subway system for a day in late January, with lots of lost economic activity.
The dollar had been helping U.S. manufacturing for some time. I am curious to see how strongly our beggar-thy-neighbor monetary policy will hurt on the rebound, now that the dollar carry trade it encouraged has reversed. The main thing I see that has changed in our favor, and could offset the effects of the recent dollar rise, is the drop in energy prices.
Contango is driving oil storage.
How is lower oil price while storing oil for expected higher future prices impacting the curves?
Lazear’s remark is right on. There’s breadth to this slowdown. Little weather effect. Though for completeness, the West Coast longshoremen strike has had a temporary effect that will be reversed in Q2 and Q3.
Weak data. Payroll employment 1 month. Hours worked 1 month. Philly Fed index each of last 4 months. Empire state index peaked 6 months ago and declined past 2 months. Chicago PMI peaked 5 months ago and down 4 of those 5. ISM manufacturing 5 consecutive months of decline. ISM services business activity fell 5 of last 7 months and is on low. Retail chain store index down 3 of past 4 months with nominal year-over-year growth near-zero. The index of industrial production has fallen 3 of the past 4 months. The year-over-year is 1.3%, sixth poorest of the recovery. Durable goods orders fell 5 of the past 7 months. Non-durable manufacturing orders fell 7 consecutive months until last month’s bounce! Not even during the recession was the string of declines this long. Sequential weekly estimates of Q1 real GDP growth by Atlanta Fed starting February 2nd: 1.9%, 1.4%, 0.3%, 0.2%, 0.1%. Constant dollar exports 4 consecutive monthly declines. Philadelphia 6-month ahead expectation for capital expenditures near a 2-year low. Existing home sales in January and February at 10-month lows. Housing starts on major low in February in NE, MW, and West with only 1 major snowstorm in late-January that might account for the drop in the NE. NAHB housing market index on 8-month low. Inventory investment is in excess, and so implies weakness until rebalanced.