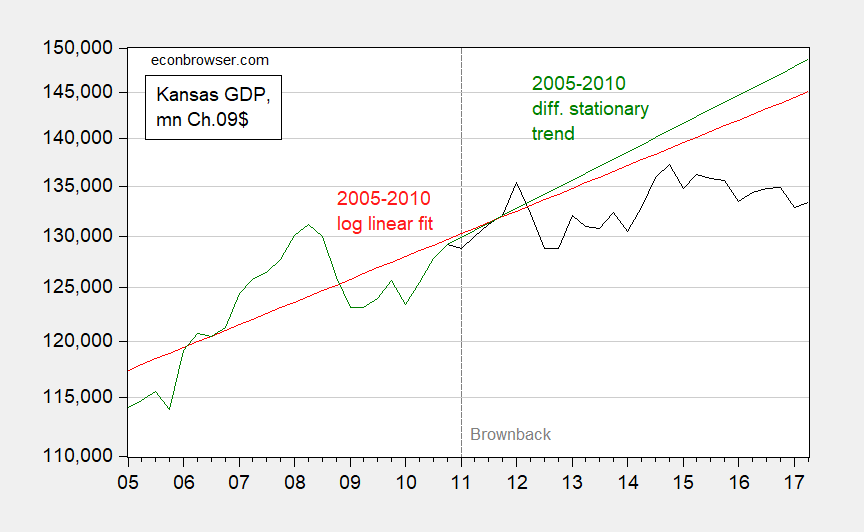
Figure 1: Kansas real GDP in mn.Ch.2009$ SAAR (black) and log linear deterministic trend based on 2005-2010 (red), a log difference stationary fit* (green) all on log scale. Source: BEA and author’s calculations.
And here is the analogous picture for Missouri:
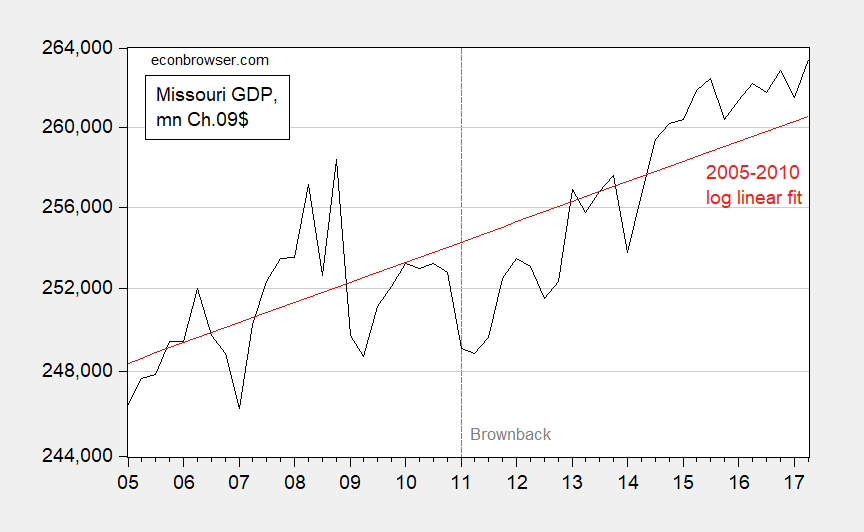
Figure 2: Missouri real GDP in mn.Ch.2009$ SAAR (black) and log linear fit based on 2005-2010 (red), all on log scale. Source: BEA and author’s calculations.
In other words, Kansas has fallen below its pre-Brownback trend; Missouri overperformed the 2005-2010 trend.
Like I’ve said before, America can be like Kansas with the Republican tax plan.
* An ADF test fails to reject difference stationary null for Kansas real GDP 2005-2010, but KPSS test fails to reject trend stationary null. I estimate both deterministic and stochastic trends as a consequence.
The American economy doesn’t have to depend on, for example, wheat prices rising from $3 a bushel in 2005 to over $10 a bushel when the recession started in December 2007, an aviation boom, that ended in 2008, and fewer highly paid government employees after 2011.
“During Brownback…the number of state government workers decreased 14 percent.”
The good news is under Brownback other parts of the economy, like leisure and hospitality, are doing well, to partially offset the major industries in depression.
This is usually the spot where a Kansas defender notes that Kansas has a lower unemployment rate than California without mentioning other variables of importance. Most obvious: California’s population is 15X that of Kansas, and it’s much larger geographically with numerous distinct geographic and economic regions.
The lack of information extends far and wide. For example, Kansas’ GDP ($147 Billion) trails that of San Francisco-Oakland (about $432 Billion) and San Jose-Santa Clara (about $235 Billion). Not noted either is that the unemployment rate(s) in these areas is as low or lower than Kansas.
Seldom mentioned either: Kansas GDP is comparable to that of metro Riverside-San Bernardino but about 1/3 lower than San Diego COUNTY.
Kansas does beat out metro Fresno and Bakersfield, areas highly dependent on agriculture where unemployment rates are indeed much higher.
But let’s hear it anyway. How Kansas is competing nicely with California and its $2.6 Trillion economy. Maybe a slogan with Brownbackian tones: “Look out California, here comes Kansas!” Or maybe whittle it down to “Hey, Bakersfield and Fresno. If you work at it, you could become Kansas!”
Paul Krugman: “Today, 60 million people live along a narrow stretch of the East Coast. Those 60 million people aren’t there because of the scenery; each of them is there because the other 60 million people are also there.”
People move to where other people live. That’s why your big metro areas have higher GDPs. California attracts wealthy and highly skilled people from the rest of the country and the world. And, the scenery, along with the weather, is much better than Kansas.
I see – your excuse for the dismal Kansas performance is its decision to move away from being a coastal state to being an inland state. I guess my old maps that had Kansas being an inland state since I was in grade school were “fake news”.
and kansas could attract, or at least keep, its best if it were not led by a dysfunctional economic policy. certainly a gap exists between the coasts and the plains. but the conservative economic experiment did nothing to close the gap, only widen the gap.
PT: Your Kansas rationalization would suggest that the Brownbackers who promised the tax cuts would increase jobs above the “normal rate”, bring thousands (35,000 in one infamous estimate) more to Kansas seeking those jobs, and put $2 Billion more into the state’s economy were (a) clueless about what they predicting (b) willing to “experiment” on millions of their own citizens without considering variable outcomes (c) simply lying (d) all of these.
It might be interesting to take a longer view of Kansas’ economy: https://fred.stlouisfed.org/series/KSNGSP
2005-08 was a period of unusual growth for Kansas’ GDP while the 2009-10 recession was unusual decline. So, if you are using 2005-10, it may or may not be a good representation of what might be considered “normal” GDP change. Perhaps a better baseline trend might be prior to 2005. If, for example, PeakTrader’s point that wheat rose in price from $3 to $10 per bushel between 2005-09, perhaps the data could be “normalized” by looking at the prices for the prior and subsequent period for a better representation of the economy.
A nice graph of the wheat commodity boom and bust:
http://www.macrotrends.net/2534/wheat-prices-historical-chart-data
I know Russia’s GDP is affected a lot by oil price swings but how dependent is Kansas on wheat prices?
pgl, it’s difficult to come up with a wheat % of Kansas GDP. Here is what Kansas published a few years back. It was the largest producer of wheat in the U.S. That may not move the GDP needle much, but could explain the some of the jump between 2005-08 in the Fed chart.
But even if we can’t adjust for the price of that commodity, I still think a longer baseline for trending Kansas’ GDP might be worth looking at.
Oops, sorry. Here’s the link: https://agriculture.ks.gov/docs/default-source/documents—office-of-the-secretary/kansas-farm-facts-august-2013.pdf?sfvrsn=5
BH: I had a friend from Indiana farm country whose favorite saying was ” You can’t make a silk purse out of a sow’s ear.” Seems apt when discussing a potential economic miracle in Kansas, especially when discussing the importance of wheat prices in diversifying the state’s economy.
Bruce Hall: I use a longer term data set, and get the same answer (but stronger):
https://econbrowser.com/archives/2017/12/brownbacks-regime-in-long-term-context