There are many ways to answer this. First, is to look at whether the index (or average of index) is above the full sample average (the unconditional mean), second, relative to other presidential terms (conditional), third, relative to presidential terms and exogenous events, or fourth relative to a more recent period, controlling for exogenous events.
The simplest is to compare the observation for March 2018 to the sample average. A time series of EPU is useful.
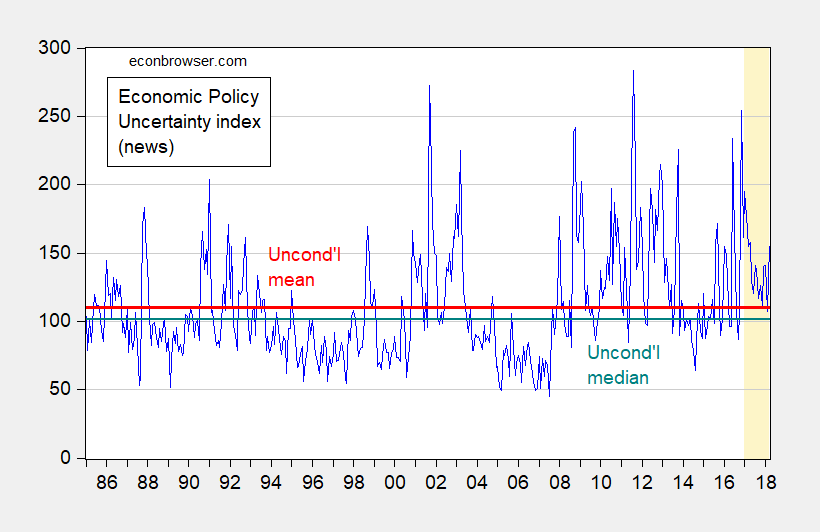
Figure 1: Monthly Economic Policy Uncertainty 1985M01-2018M03, news based (blue), unconditional mean (red), and unconditional median (teal). Orange shading denotes Trump administration. Source: http://www.policyuncertainty.com.
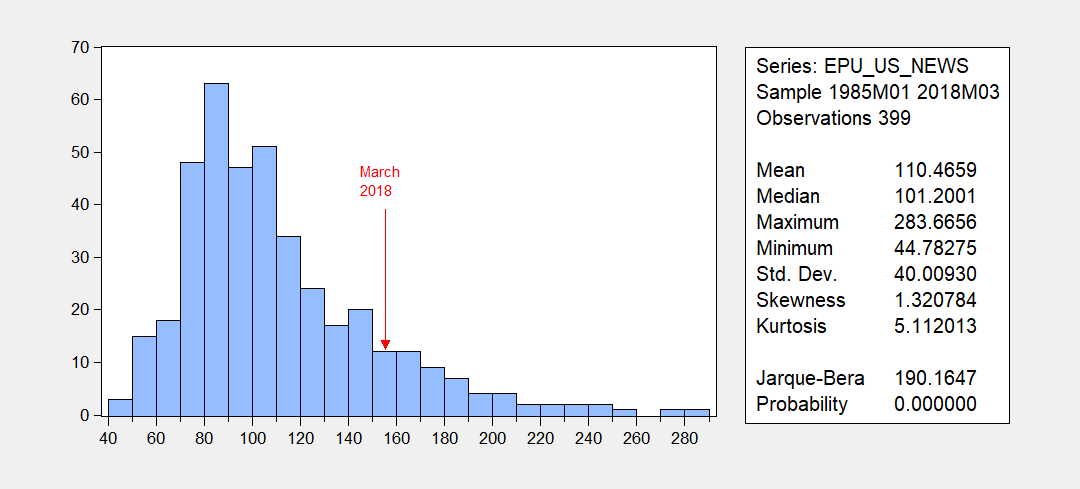
Figure 2: Histogram of Monthly Economic Policy Uncertainty 1985M01-2018M03, news based (blue bars), and March 2018 value (red arrow). Source: http://www.policyuncertainty.com.
The March 2018 observation is over one standard deviation away from both the mean and median, so that observation is not particularly likely to be observed in this distribution. The histogram indicates that the series is non-Normally distributed, so more careful analysis is in order.
One might want to know if the average value is higher during the Trump period as opposed to other presidential administrations. One could run an OLS regression of EPU on dummies for presidential terms. OLS is BLUE if the errors are Normal. However, if they are not, then alternative methods come to mind.
One alternative estimation method that might be better is robust regression (Huber) which downweights outliers (suggested by the highly non-Normal distribution displayed in Figure 2). This approach essentially predicts conditional medians. Now, I include dummies for presidents. Since Reagan is omitted, the constant pertains to the conditional mean for the Reagan administrations.
(1) EPU = 102.27 + 3.09GHWBUSH -15.08CLINTON -6.81GWBUSH + 22.42OBAMA + 37.37TRUMP
Adj.-R2 = 0.14, SER = 37.17, N=399. bold denotes significance at the 10% MSL.
The interpretation of the coefficients is as follows: median EPU during Reagan (from 1985M01-88M12) is 102.27, during GHW Bush is 105.37, during Clinton is 95.46, during Obama is 124.69, and during Trump is 139.64. The standard error on TRUMP is 8.98, which means that uncertainty is definitely higher than during the Reagan period. The fitted values are shown in Figure 3.
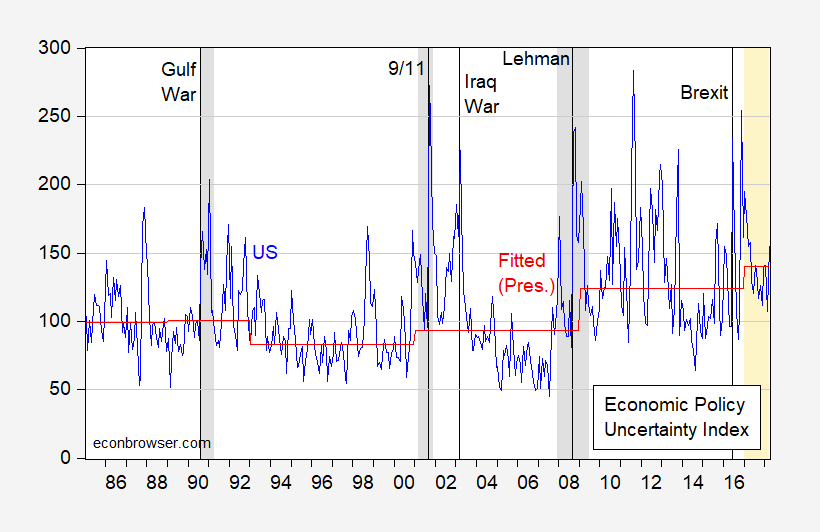
Figure 3: Monthly Economic Policy Uncertainty 1985M01-2018M03, news based (blue), fitted values (red). Orange shading denotes Trump administration. Source: http://www.policyuncertainty.com.
Is uncertainty higher than during the Obama period? An F-test for equality of the OBAMA and TRUMP dummies rejects at the 7.7% significance level. So, the answer is yes.
Finally, one can estimate a relationship conditional on presidents and exogenous events like 9/11. That regression answers the question of whether uncertainty during Trump is higher than what is to be expected conditional on various factors. The robust regression results are:
(2) EPU = 99.86 + 7.55ELEC_TRANS – 5.22GHWBUSH -16.14CLINTON -15.38GWBUSH + 15.69OBAMA + 32.83TRUMP – 0.08DIVIDEDGOV + +32.96PERSIANGULFWAR + 136.279/11 + 79.77IRAQINV + 26.15LEHMAN + 76.20BREXIT + 18.41RECESSION
Adj.-R2 = 0.26, SER = 32.00, N=399. bold denotes significance at the 10% MSL. The fitted values are shown below.
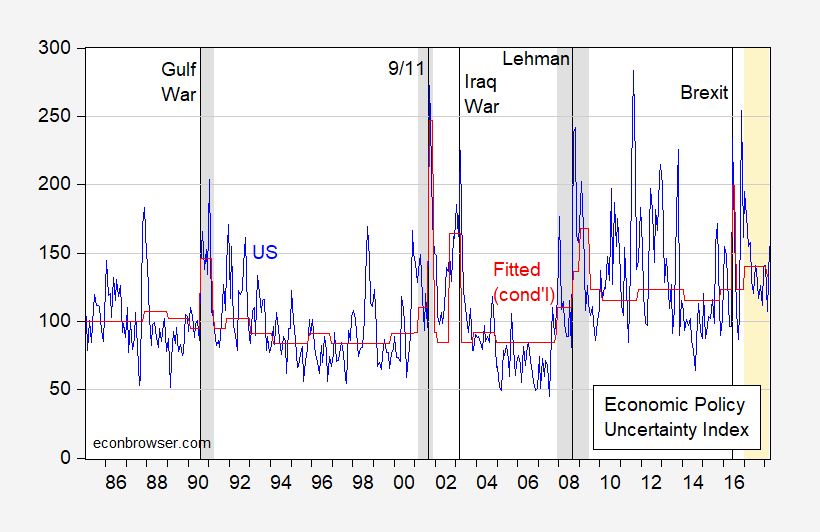
Figure 4: Monthly Economic Policy Uncertainty 1985M01-2018M03, news based (blue), fitted values (red). Orange shading denotes Trump administration. Source: http://www.policyuncertainty.com.
Now, as compared to OLS, it’s a little harder to interpret the results from robust regressions (as they pertain in this case to changes in conditional medians rather than means). Instead of running robust regression, one could log the dependent variable, and re-estimate using OLS, and see if the residuals are more Normal. The corresponding results are:
(3) LOG(EPU) = 4.548 + 0.089ELEC_TRANS – 0.058GHWBUSH -0.158CLINTON – 0.132GWBUSH + 0.192OBAMA + 0.308TRUMP – 0.043DIVIDEDGOV + 0.290PERSIANGULFWAR + 0.7149/11 + 0.667IRAQINV + 0.224LEHMAN + 0.406BREXIT + 0.160RECESSION
Adj.-R2 = 0.38, SER = 0.263, N=399, DW=0.90 bold denotes significance at the 10% MSL using HAC robust standard errors.
The interpretation of this regression is that uncertainty is 31% higher during Trump than Reagan, controlling for exogenous factors and recession. Given the log-linear specification, we can say that uncertainty under Trump is 12% higher (in log terms) than under Obama, after controlling for divided government, Brexit and recession, as well as the election. The fit is shown below, as is a histogram of the residuals.
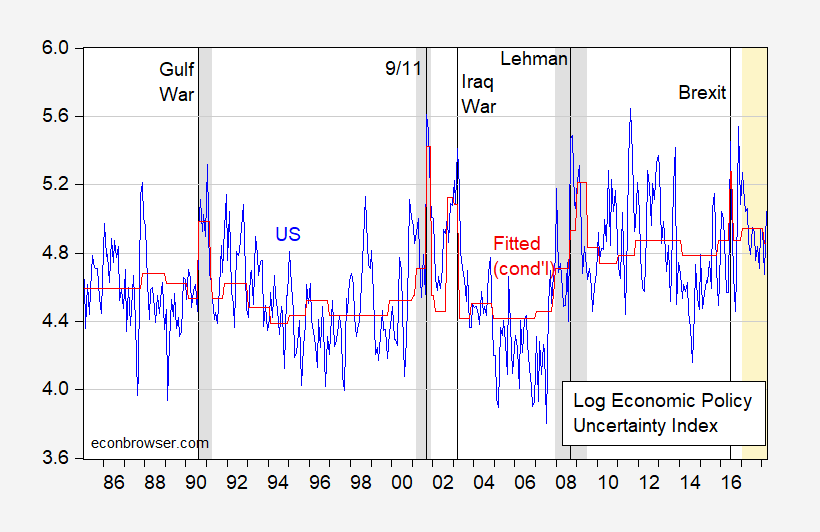
Figure 5: Log of Monthly Economic Policy Uncertainty 1985M01-2018M03, news based (blue), fitted values (red). Orange shading denotes Trump administration. Source: http://www.policyuncertainty.com.
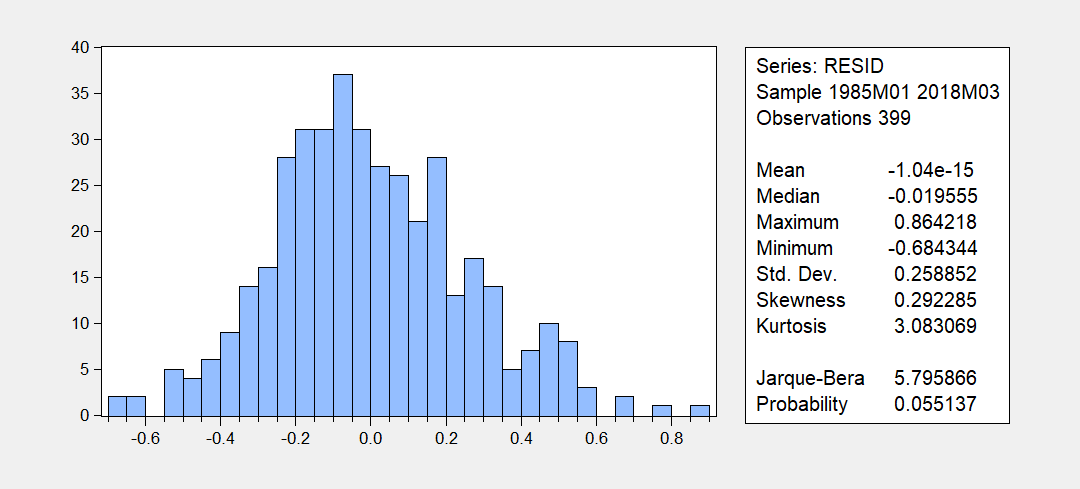
Figure 6: Histogram of residuals from regression equation (3) (blue bars). Source: http://www.policyuncertainty.com.
Note that one can’t reject the null hypothesis of Normality of residuals at the 5% MSL.
Ed Hanson has asserted that uncertainty under Trump is no higher than it was in 7 of the last 9 years, and focuses in particular 2008-13. If I select that period, it’s true uncertainty doesn’t look particularly high. But on can arbitrarily select particular periods to compare against in order to not find a difference. In order to guard against that arbitrariness, I compare against the last decade. To do that, I estimate the preceding equation, constraining all presidential dummies to be zero except for TRUMP, and defining a dummy variable LASTDECADE which takes on a value of 1 from 2008M04-2018M03 This leads to the following OLS regression results.
(3) LOG(EPU) = 4.427 + 0.088ELEC_TRANS 0.142TRUMP – 0.069DIVIDEDGOV + 0.449PERSIANGULFWAR + 0.8009/11 + 0.642IRAQINV + 0.224LEHMAN + 0.407BREXIT + 0.039RECESSION + 0.288LASTDECADE
Adj.-R2 = 0.36, SER = 0.268, N=399, DW=0.90 bold denotes significance at the 10% MSL using HAC robust standard errors.
These results indicate that compared to the last decade, after conditioning, average uncertainty under Trump has been 14.2% higher. The fitted values are shown in Figure 7.
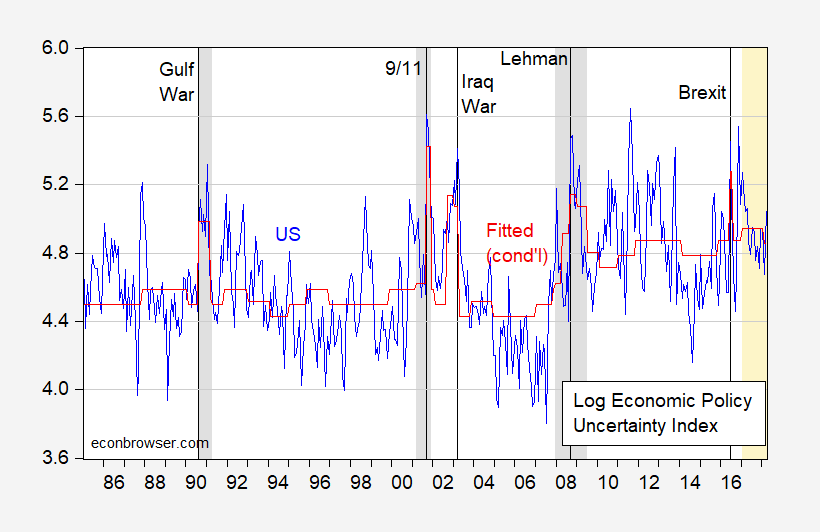
Figure 7: Log of Monthly Economic Policy Uncertainty 1985M01-2018M03, news based (blue), fitted values (red). Orange shading denotes Trump administration. Source: http://www.policyuncertainty.com.
Since the TRUMP coefficient is 0.142, this means that the Trump period has been characterized by 14.2% higher uncertainty than over the past decade. So for me, economic policy uncertainty is elevated during the Trump administration, as compared to earlier periods, conditioning on elections, recessions, and exogenous events.
Data here (except for LASTDECADE variable).
I’m a night owl, and one of the many reasons I like this blog is Menzie puts gunk (“gunk” being used as an affectionate term here) up late at night to chew on and ponder. I was watching “Baby Driver” and the waitress with the legs in the diner at the start of the film was getting me too excited so I had to take a intermission (joke, not really). Well, I’m not gonna go nuts doing the math/stats tonight, I just don’t have the energy. I’m gonna have to get out my old college stats book and clear off the dust or see if I can find a statistics professor with a blog as cool as Menzie’s to look up and figure out how to do this analysis properly. I think Menzie has been borderline obsessive compulsive on this topic of uncertainty, but I like people that are obsessive compulsive and this gives me more stuff to backcheck my OLS regressions in “OpenOffice” program (Like 5 years from now when I finally figure out how to do it), so if Menzie wants to be obsessive compulsive on this topic I’m all for it.
My main problem with Trump is, he’s such an immoral nutjob, with below average intelligence, more focused on his own navel than the world around him, it makes it harder for me to sleep at night wondering where the F___ this country is going. If that counts as a “high in uncertainty”, you sure as hell don’t need to convince me.
I’m kinda half-asleep right now, reading up on some of these stats papers. I finally figured out how to turn html into pdf with just some clicks and that’s helping me out a lot. I think like, one of the things I was doing wrong was jumbling up all of the column B numbers together, instead of doing the OLS in different segments yeah?? (Maybe this was apparent to 80% of the blog’s readers but me). Also I think I was having problems understanding the dummie thing and actually how to account for that in the equations and I’m slowly getting that now. They may have to create a whole new cottage industry for me “Dummie Variables For Dummies”. I am founder of this group, and PeakIgnorance has honorary membership.
Trump and dummies – kind of redundant!
Hindsight is a bitch. https://www.cnbc.com/2017/05/18/economic-uncertainty-index-surpasses-08-financial-crisis-levels.html . Yeah, economy takes a dive… didn’t happen.
OLS is BLUE if the errors are Normal.
Since the title of the post suggests Stat 101, some folks might think you were referring to a color. For their benefit, BLUE means “Best Linear Unbiased Estimator”. The acronym OLS means “Ordinary Least Squares”; i.e., you find the fitted line that minimizes the squared distance between the actual observation and the fitted observation. And the reason there isn’t a separate dummy variable for Reagan is because the Reagan years are captured in the intercept, as Menzie noted. If you tried to add a separate dummy variable for Reagan, then you would not be able to solve the regression because of what’s known as an “identification” problem. And there’s no particular reason why you would have to use Reagan as the intercept; you could use any of the Presidents, but it’s more natural and intuitive to write the regression in the historical order of the Presidents. But you could give Reagan his own dummy variable and then let one of the other Presidents be captured by the intercept and it wouldn’t change the relative differences.
@2slugbaits
Conceptually, I already knew everything you were stating there, except, I am pretty ashamed to admit, the BLUE part (he typed with a red face, red here being the color, haha). So actually what you said about BLUE was helpful to me. Thanks. I am not too ashamed to admit something which I do not know. Which, I can think of at least 3 commenters on this blog could learn from.
…because of what’s known as an “identification” problem.
For those who took linear algebra somewhere along the line, this means the determinant goes to zero and the matrix cannot be inverted.
Remember how PeakIgnorance insists China steals US intellectual property as a precondition for selling goods there? Columbia Sportswear would disagree:
https://www.caixinglobal.com/2018-04-12/columbia-sportswear-buys-out-its-china-joint-venture-101233649.html
@ pgi
I am not into “trashing” China. I have a deep affection for the people there, for reasons not to be explained on this blog (also some “love/hate” aspects there). Be that as it may….. I get no “kick” from trashing China just for the sake of “trashing” China. But no reasonable objective observer (who actually know what the F___ is going on over there, can deny they manipulate trade deals to steal IP and steal superior manufacturing processes.
I do not like to “line up” on PeakIgnorance’s side of the field. I do not want to be on PeakIgnorance’s team in the metaphorical pick-up basketball game. This is reality. And whether you bleed Chinese blood or not doesn’t Have ____ to do with it.
My concern has been an inherent bias, both in the article’s author, and the press from which much of this data is drawn. This article (behind a pay wall) https://www.washingtontimes.com/news/2017/dec/12/media-bias-continues-90-of-trump-coverage-in-last-/
says as 2017 ended the media coverage continued to be negative. Media bias continues: 90% of Trump coverage in last three months has been negative, study says.
Additional review of the data sources showed a high level of circular reporting of Economic Policy Uncertainty data/reporting. also included in that review was references to Menzie’s own article(s). Perhaps for skeptics the uncertainty revolves around the source’s own biases. For instance EPU says this about their methodology:
“The first component is an index of search results from 10 large newspapers. The newspapers included in our index are USA Today, the Miami Herald, the Chicago Tribune, the Washington Post, the Los Angeles Times, the Boston Globe, the San Francisco Chronicle, the Dallas Morning News, the New York Times, and the Wall Street Journal. From these papers, we construct a normalized index of the volume of news articles discussing economic policy uncertainty.”
And then reviewing these references in the 2018 source list: https://seekingalpha.com/article/4154050-trump-special-economic-policy-uncertainty-levels-perspective (Menzie reference) and Brinkwire, “Household inflation expectations have subsided”, and Wall Street Journal, “Under Trump, a Strong Economy but Murky Policy Outlook” (behind pay wall) and a circular reference to EPU.
Out of the 9 2018 article references, I found one was to a foreign source, and at least three were circular. Is there bias in the data? Might be. Without reviewing each article it isn’t clear, but there certainly is doubt.
Using a source that is overwhelmingly biased against the Trump administration certainly adds uncertainty to the validity of the data.
Policy uncertainty news based = f(normal uncertainty, negative media bias)
I will be busy for a while so more posts on the subject will have to wait. For now I will just comment on the part of Menzie’s post which referred to me.
Menzie wrote in part; “Ed Hanson has asserted that uncertainty under Trump is no higher than it was in 7 of the last 9 years, and focuses in particular 2008-13. If I select that period, it’s true uncertainty doesn’t look particularly high. But on can arbitrarily select particular periods to compare against in order to not find a difference.”
First I ask Menzie if he meant to write “does look” rather than “doesn’t look.” To continue, I certainly see higher uncertainty for that period. Menzie warns about arbitrariness of time period selection. Duly noted and is in general valid. I point out that this ‘arbitrary’ time is 5 years. And that is about 4 times the length of President Trump’s time that Menzie is using to measure. In addition, Menzie also compares a short time of the current President against full terms of other. Menzie in the past has warned about too small of a sample. This fits that warning, both, by it small length of time as well as its comparison to full President’s time in office. And, of course, use of a single month certainly fits that warning.
Some times it is interesting to use a small sampling, but it is also of interest to study an ‘arbitrary ‘ 5 year period of time especially since it is recent. I’ll end this with my usual. This is an analysis by the political Menzie using economics to justify a conclusion rather using a general study by economics method to flush out incite. Remember, Menzie wrote at least 16 posts about Uncertainty during President Obama and never once mention him or his administration. This too was an example of the political Menzie.
Current uncertainty level is quite normal for the latest 9 year period. 7 of those years exhibit similar to higher uncertainty.
Ed
Ed Hanson: No, I meant “doesn’t look”.
1. Re: One observation (March 2018) vs. conditional mean — if you compare one observation to a sample mean, one should use a standard *deviation* to judge whether that one observation is likely or unlikely to come from that distribution. Gee, that’s what I did.
2. Re: Small sample (14 observations) vs. ten years of monthly data — if one wants to see if one sample is likely to come from a different distribution than another sample, one can compare the differences in means, and see if the intercepts/constants are the same. For large sample, use Chi-squared in your Wald test. For small sample, use F-test. Gee, that’s what I did.
Suggest you consult a basic statistics textbook.
3. Re: Five year sample — If I were to pick a five year sample to compare against, I would compare to the immediately preceding period (2012-2016), *not* 2008-2013… who chops out the most recent two years immediately preceding the period of focus?
When I read the narrative about the “uncertainty index”, I had to chuckle. The softness of the data is extraordinary; so much that I wonder if it anything more than an attempt to explain some of the turmoil reported by the media when the media are the source of the turmoil. http://www.policyuncertainty.com/us_monthly.html
Let’s face it: Trump is never going to be a left-of-center media favorite. So, when his “non-presidential” style ruffles the feathers of the left (USA Today, the Miami Herald, the Chicago Tribune, the Washington Post, the Los Angeles Times, the Boston Globe, the San Francisco Chronicle, the Dallas Morning News, the Houston Chronicle, and the Wall Street Journal), it’s a bit disingenuous to say that it reflects economic uncertain within industry or among consumers.
the Rupert Murdoch owned Wall Street Journal is now “the left”?? Bruce, you are aware the man who owns FOX news is Rupert Murdoch, yes?? Wow Bruce Hall, I haven’t felt this educated since Tucker Carlson’s Panda Apocalypse:
https://www.youtube.com/watch?v=ciYXvWbyl00
Earnest question for you Bruce, is it just the fact that occasionally you need to have above a 3rd grade reading level to get anything out of a newspaper that is bothering you??
Honestly, Big M. You’d think that in a list of 10 papers where 8 were bolded and, just prior to the list, the word “left” was bolded, you might be able to pick out the two that were not similar.
Oh, wait, you didn’t read the webpage of the uncertainty index source. Okay, I understand. It wasn’t on YouTube.
@ Bruce
I’m sorry to inform you Bruce, but most people with above a GED level education, would have worded and delineated that in a different way. They wouldn’t have put different categories inside the same parenthesis, after the same descriptor. But that’s cool if that’s how you write. I know you look at a lot of Trump tweets for guidance, so the sloppiness is understandable.
M
If you had read the linked webpage (which I am certain you did not), you would have seen the parenthetical listing of “uncertainty” sources was a direct lift from that page. Sorry the linked material was so “sloppy” for you. Next time, I’ll spell out in great detail all of the nuances. I should have been more careful since this post was, after all, for “dummies”.
@ Bruce Hall
Poor slow-minded Bruce. Bruce, did you tell your 5th grade English teacher “Oh Miss Smith, I don’t need to learn how to write properly. If people can’t understand what the hell I am writing, I can link it to a webpage that states it correctly.” Or am I assuming too much that you made it to 5th grade?? Maybe you graduated high school in a state with poor public schools?? Like maybe you reside in Alabama where an overwhelming majority of Republican voters voted for a pedophile judge running for U.S. Senate?? Let me know if you’re from Alabama and I’ll stop giving you a hard time, as then that would be justifiable why English appears to be your second language. I doubt the source communicates political leanings of newspapers by bold print as you did, as the authors of the EPU study have a better than 4th grade reading/writing level.
Bruce Hall: If only The National Enquirer had been included, then we could rest easy that we had an unbiased sample.
5-stars. That’s one of those I wish I would have been quick-witted enough to quip.
NY Times: Mr. Pecker’s company sought to silence her by buying the rights to her story in August 2016 for $150,000 but never publishing it. In the tabloid industry, that move is known as a ‘catch and kill.’ ”
Be pretty cool to have a lawyer/”fixer” to take out an illegally obtained home equity loan to purchase your dirty laundry wouldn’t it?? Oh wait, that’s only cool if you’re an immoral scumbag. Imagine if a black President had pulled that same stunt. All the hypocritical evangelicals would have verbally castigated him for the next 50 years. Fat slob white guy with a red squirrel cadaver on his head and you get talked about on Trinity Broadcasting Network like you’re up for canonization and the Southern Baptists are ready to send their virgin daughters by Fed Ex care package to be his 4th wife.
https://www.nytimes.com/2018/03/29/us/politics/trump-national-enquirer-david-pecker.html
You’d think his ____ Melania would say something, at least so her son knows she has some self-respect. I guess Melania figures he’s long bored by now and she got “the long-term contract”.
Also imagine an African American First-Lady candidate plagiarizing a convention speech from a white First-Lady still residing in her capacity as First-Lady?? And they invited her to Barbara Bush’s funeral!?!?!?! I think Melania’s “natural habitat” would be the local hotel during business conventions.
Trump has defended himself on the Moscow mattressPP story by saying “I’m a germaphobe”. Really!!?!?!?! A “germaphobe”??? What kind of “germaphobe” sticks his schlong in every skank willing to debase herself?? Where does that rank on “the to-do list” of your typical “germaphobe”??
Ah, yes. It’s hard to perceive bias when it is one’s normal. But I digress. I simply did a Google search on *newspaper name* political orientation, so it’s not my personal assessment of potential bias.
Nevertheless, to my point that was not addressed by snarky comments: The softness of the data is extraordinary; so much that I wonder if it anything more than an attempt to explain some of the turmoil reported by the media when the media are the source of the turmoil.
We would expect Trump to have a higher uncertainty index. That’s what ‘shaking things up’ means. On the other hand, that’s not enough.
@ Kopits
Still waiting for Xi Jinping to unconditionally surrender to mainland Chinese peasants??—when was it you said, in 3050?? Or are you trying to remember why you named your blog “Princeton Policy Advisers” when you apparently have no connection to the University or township??
Sorry Steve that does not necessarily follow. If Trump had a coherent plan you would not have a lot of uncertainty. If he does not and you don’t really know what he is going to do next then you do have a lot more uncertainty.
More so when you have the same party holding power in all three offices.
Is the uncertainty about policy changes, or the nature of policy changes? For example, during tax reform negotiations, many different proposals were floated. This is uncertainty. Or was the uncertainty about tax reform as a whole. Or is the uncertainty about the sustainability or ultimate impact of policy? I am not sure what we’re measuring here.
Again, I would expect to see higher uncertainty with Trump. It doesn’t surprise me. The question is the ultimate policies which arise as a result. So again, I am back to the ‘so what?’ question. I just don’t think this is really all that interesting a point to argue, not unless we can link uncertainty as such to some kind of outcome, say, GDP growth.
Yup That’s what I tried to get across.
There are frankly more interesting things to consider. For example, should we build another rail tunnel to 34th St, or bring the 7 subway line out to Secaucus?
No amount of statistical gymnastics is going to remove the bias under lying the data. More ever more complex models/tests only show the need of the author to hide the bias.
Steven Kopits: I had to sit through all sorts of people rambling about how high economic policy uncertainty was hampering growth because of … Obama. Now this is an irrelevant question why economic policy uncertainty is elevated (or even if it is)?
Anyway, economic uncertainty is what I’m talking about in my macro course, so at least I find it interesting.
Yeah, ok, there is a lot of rambling. But, honestly, it seems so ‘so what?’ to me. Of course Trump brings policy uncertainty. You’d have to be living in a cocoon not to know that. It’s just not that interesting, unless you can show it to link to something. Does it?
Meanwhile, Slugs and I have started a conversation about demographics and the durability of democracy. That’s actually an interesting conversation, and quite relevant for macro. If demographics are decisive, then our entire system of governance may not last.
On the other hand, the dynamics of depression may be different from recessions. Under such a line of reasoning, the Great Recession was a crypto depression which ended in Q2 2014 in the US and Q4 2016 in Europe. Now, if that view is right, then that has myriad implications, which we could discuss here for quite some time. For example, if the crypto depression hypothesis holds, then Steve Bannon is toast (he is), the Alt-Right will implode (it is), and democracy will be resurgent in places like Hungary, Russia, Venezuela, Nicaragua and even China. Brexit would fail in a follow-on vote today. In such an event, long-held Republican values will re-emerge and the guys on the fence should just sit tight and hold the line.
It matters a whole lot which model is right.
@ Menzie
Isn’t it strange how the “usual suspects” get so angry when an African American president is supposedly causing “uncertainty” (because the Republican obstructionists block every proposed bill, including better structured economic stimulus packages)?? But when the money-laundering, lady-parts molesting, influence peddling white male they have a man crush on damages markets, they don’t want you do engage in that topic.
Gosh Menzie, can’t you learn the Sieg Heil salute like Robert W. Goodlatte, Devin Nunes, and Trey Gowdy?? Republican congressman have worked so hard to set the proper example for you, be “a good boy”.
So it looks like the St. Petersburg trolls are trying to shift the argument. Initially Ed Hanson and CoRev didn’t seem to have any qualms about the data or the data gathering methodology. Apparently that’s because they were confident in their ocular analyses. But after a more formal analysis showed that eyeball statistics can be deceiving, now suddenly they have all kinds of doubts about the raw data; it’s biased, it’s circular, it’s this, it’s that. Why didn’t they express those doubts when this topic was first introduced? Like I said, I think it’s because they looked at braindead charts without doing proper statistical tests. And no, those tests are not “complex models/tests”; they’re what you would get along about the second week of a basic community college stat course. And I think I’d know because in my retirement I now do volunteer tutoring at a local community college.
A second problem with the whining from the Trump camp is that they are conflating “news bias” with “uncertainty.” You have to make a pretty strong case that bias in the news leads to economic uncertainty. Uncertainty and bias are two very different concepts.
A third, related problem the whiners face is that most of the movers and shakers in the financial world get their news from the mainstream media. So if they are getting their news from a consistently anti-Trump media, then shouldn’t that lead to greater policy certainty because it tends to reinforce a negative view of Trump. If Trump wheeler dealers on Wall Street believe that Trump is going to pull out of TPP because the mainstream media says so, then shouldn’t that reinforce the belief that Trump will in fact withdraw from TPP? How does reinforcing one’s beliefs (even if those beliefs reflect bias) result in less certainty rather than more certainty? I suspect that most big time financial players understand and discount any bias there might be in the media. What they have a hard time discounting is the fact when Trump tweets something a 5:00am and then tweets the complete opposite at noon. One day North Korea’s leader is “little Rocket Man.” The next day he’s Trump’s best buddy. One day we’re implementing sanctions against Russia. A few hours later Amb. Haley was confused and we aren’t implementing sanctions. One day Trump says he’ll sign any healthcare bill the Congress agrees to; then after they come to an agreement Trump nixes the plan. That’s uncertainty, not media bias.
2slugs asks: “Why didn’t they express those doubts when this topic was first introduced?”. The answer is simple, we (at least I) didn’t care about such an arcane subject until Menzie made it his mission. After being called out Ed and I have had to do enough research to validate menzie’s or our own views. I stand by my analysis of the under lying data being biased.
2slugs and Steven make a case that economic “uncertainty” exist. Yup! Uncertainty is with us in all things, but the issue has been measuring the changes and comparing with other administrations. A problem with this position is that they are conflating “economic” with “political” uncertainty. Compounding this is the snarky political commentary they use. 2slugs, political uncertainty is just one of the exogenous factors, and IIRC one Menzie did not list in his model.
As Steven said: “But, honestly, it seems so ‘so what?’…” compounded with “No amount of statistical gymnastics is going to remove the bias under lying the data. More ever more complex models/tests only show the need of the author to hide the bias.”
CoRev Ed and I have had to do enough research
But part of Menzie’s task was to demonstrate the difference between actual “research” and simple eyeball analysis. Hopefully this exercise was a teachable moment and you picked up a few tips on how to do a formal analysis.
I stand by my analysis of the under lying data being biased.
You missed my point. Bias is not the same thing as uncertainty. In fact, bias has the effect of reinforcing one’s views, and reinforcing one’s views is the exact opposite of uncertainty. Take two groups. One only watches MSNBC and the other only watches Fox News. Both groups will probably exhibit bias, but both sides will be equally certain about the direction and consequences of Trump’s policies. If I know that a die is biased, that will only make me more certain that it will roll a specific value. Bias is not the same as uncertainty.
the issue has been measuring the changes and comparing with other administrations.
I think that’s exactly what Menzie did. How else do you understand those regression coefficients?
political uncertainty is just one of the exogenous factors, and IIRC one Menzie did not list in his model.
Do you think Menzie should have included a different set of dummy variables? Such as…??? Divided government? Wars? Presidential terms? Oh wait, all of those were included. How would you have specified a regression?
As Steven said: “But, honestly, it seems so ‘so what?’
I agree with Steven Kopits that demographics and the survivability of democracy are more urgent problems than a simple econometrics exercise; however, I believe that part of the demographic problem is an ever widening gap in education. For example, one of the major cleavages is the line between college educated whites and non-college educated whites. And that cleavage seems to apply across the OECD countries. So posts that provide the general public with examples of the right way to do an analysis should be seen as teachable moments. Maybe it’s the Neo-Platonist in me, but I do believe democracy’s best hope lies in nudging people out of the cave. So instead of complaining that your eyes hurt as you emerge from that cave, take time to read and reread Menzie’s explanation of how to interpret regression coefficients and the difference between conditional and unconditional means. I don’t think democracies can survive in we have to depend upon the wisdom of Angela Merkel’s “Swabian housewife.”
2slugs, you do not understand that no amount of statistical manipulation improves the original data. Biassed, circular self referencing data remains garbage. Measuring garbage results only in garbage measurements. I know you know the phrase GIGO.
Everything else you have said is to rationalize away this truth.
There is another truth about “economic uncertainty” it is a way too broad of a term. Like climate change it is meaningless without defining the component(s) of the whole to which you are measuring.
corev, please stop. 2slugs just presented you with a great teachable moment. and you are simply too stupid to even understand that. you need to quit commenting about “data”. if you took your understanding of data and tried to apply it in the real world, say as a consultant, your clients would fire you in two shakes. rather than applying scientific and mathematically sound concepts to the data, you are doing exactly what 2slugs describes with the swabian housewife example. you give too much credibility to your intuition, and not enough thought to the mathematical tools-which are unbiased.
baffling: Give it up. CoRev clearly doesn’t understand basic stats, and doesn’t even understand what a F-test does (and/or a t-test for differences in mean when sample sizes differ).
Is there a widening gap in education?
Good question. I meant a widening gap between education and voting behavior. The data I’ve seen show that white college educated voters…especially younger college educated voters are moving to the Democratic party while less educated white voters are moving to the GOP. That’s kind of a flip from the way it was years ago when educated white suburbanites tended to vote for moderate Republicans. Back when I was a kid suburban voters took the Chicago Tribune and urban voters took the Sun-Times. And the folks that really wanted to get the straight news got the old Chicago Daily News in the afternoon. Now the Tribune appeals to more “good government” type moderate suburban voters who are tending to vote Democratic. Anyway, I think this sorting out between education and voting patterns is a real problems because it implies different ways to understand how the world works. Fifty years ago someone with a high school education could understand about 90% of macroeconomics. Today that same individual would have a hard time understanding 1%, so they rely upon intuition and personal experience. That’s why I see Angela Merkel’s “Swabian housewife” as a real threat. It’s not the housewife’s thriftiness that’s the problem; it’s her reliance upon personal experience and intuition that’s the problem.
In a depressionary model, because it is a balance sheet (collateral) recession, the interest rate mechanism does not work well. Thus, lowering interest rates does not do much to stimulate the economy. Instead, the excess loss of principal (both realized and unrealized loss) of capital must be worked off, and this requires time, perhaps 7-10 years. During the interim, interest rates will be low, and asset values will be high. Investment will be low, wage gains may be low or negative, and unemployment will be high. Thus, the rich will be getting richer even as the middle is getting poorer.
The middle class, who has traditionally deferred to the elites — even if the elites are resented — becomes disillusioned with elite leadership, both left and right. After a couple of election cycles, they are open to non-orthodox approaches, upsetting traditional trading relationships (Brexit, America First) and entertaining out-of-the-mainstream leadership (Trump, Macron). These are populist responses, with ‘populist’ meaning ‘internally inconsistent’ propositions, for example, “We need a capitalist economy free from foreign competition”. “Keep your hands off my Medicare.” At that moment, however, voters are looking for an alternative, any alternative, even if it is strictly speaking, incoherent.
At some point, however, the ZLB no longer holds, the Taylor Rule Rate rises above the Federal Funds Rate, and the interest rate transmission mechanism slowly begins to function again. The elites gradually regain credibility and the populists fade.
This is the business cycle — the 70 year business cycle — interpretation. Thus, it is not so much above education, in this view, as once in a lifetime (let’s hope) catastrophic economic disruptions will leave commensurate distortions in the body politic.
Menzie,
I would like to thank you for enabling those of us who did this elementary econometrics whilst studying economics to get us up to speed again. It is on those people who suggest the data is ‘unreliable’ to show why it is.
Amen brother. Wish we had more like you in “the States”. Republicans have finally sucked the life out of k-12 public schools here I guess……
The tax cuts likely created uncertainty, given it’ll add to an already huge debt. And, there’s greater uncertainty, because of the mainstream media, which manipulates and speculates, including the tax cuts will do more harm than good for the typical American. There’s no need for Putin to pit half of Americans against the other half. And, I’m sure, there will be more boycotts, hysteria, and activist events on one side and more optimism, confidence, and rallies on the other. The outcome is uncertain.
Peak
There is a trap out there, and it is the idea that uncertainty is bad every time. It is not. Change can cause uncertainty and that same change can cause good. The status quo of the US before the election was expanding government power, low growth, and the likelihood of additional tax rate hikes which would just continue the routine we have been stuck in since the great recession. The expected would lead to less uncertainty but a stagnant economy, more of the same. The election was the change. The promise that for 4 years, the regulatory structure strangling innovation was going to be diminished, Obamacare was going away, tax rate were coming down. All this leading to higher and sustainable growth. But that change causes realignment of what moves the economy. The big corporations which fed on big government, complex regulation, relative certainty of government intervention on their behalf when things go bad could longer be relied on.. And this is a good thing. It is small business that thrives in the present environment. That is the source of the continued increase in employed numbers. And better yet the developing small businesses will bring real competition to those big businesses which were contented before. All this causes uncertainty and is a good thing.
Does that mean to accept the treatment of uncertainty by Menzie? No. He is still limiting his periods of investigation to maximize results toward his political bias. He refuses to use the same calculation on the first 15 months of Obama 1st term although that is a reasonable parallel time to President Trump’s current time in office. It would show, qualitatively and numerically, that time period was similar in uncertainty And expecting Menzie to analyze the first 4 or 5 years of President Obama’s time in office is out the window. He knows that it would give a numerical summation that could be used to compare the next 35 months of President Trumps first term. We know why he refrains from the fact that during the 8 years of President Obama never once within Menzie’s 16 uncertainty posts did he mention the President nor anyone in his administration much less assign responsibility to them. It goes against his bias which comes from his politics. I suspect he is worried about what we have confidence in, the greater growth during President Trump’s term will become the norm and uncertainty will fall.
Ed
“The tax cuts likely created uncertainty, given it’ll add to an already huge debt.”
A radical departure from the usual Fox & Friends spin we expect from you. Or could this be – a Russian bot has hih jacked Peaky’s computer!
Of the 100 largest newspapers, only two endorsed Trump. Many republicans didn’t vote for Trump. Mainstream media coverage is about 95% negative on Trump with lots of dishonesty. Certainly, there has been some influence on the population. The stock market anticipated tax cuts and deregulation, since Trump won the election. Trying to get better trade deals created some uncertainty, but there are also a Watergate-type of investigation, legal opposition, lawsuits, anti-Trump government bureaucrats, etc..
PeakTrader Of the 100 largest newspapers, only two endorsed Trump.
So I guess that tells us one of two things. Either Trump voters are illiterate and can’t read newspapers, or Trump voters rely disproportionately on Russian bots and the Internet Research Agency for news.
2slugbaits, you only need an eighth grade education to read a newspaper.
Obviously, journalists were wrong about Trump.
Anyway, I think, there was only a 10% chance of Trump winning.
There’s lots more propaganda in U.S. newspapers – Russian bots or news don’t even come close.
“you only need an eighth grade education to read a newspaper.”
Let us know when you finally make it to the 8th grade.
If the stock market was anticipating the Trump tax cut I would expect it to be reflected in a higher PE. But the PE on trailing operating earnings was lower after the election except for a short period in last December & January.
Yet, the stock market rose at a much steeper rate after the election, than in the immediate prior years, culminating in a blow-off top in January this year. The stock market did anticipate tax cuts. Who knows what the P/E would’ve been, if Hillary won.
The stock market appreciated faster after the election that before? Why not provide some link to show this? Here is how Yahoo Finance sees it and it does seem you have lied to us again!
https://finance.yahoo.com/quote/%5EGSPC/chart?p=%5EGSPC#eyJpbnRlcnZhbCI6IndlZWsiLCJwZXJpb2RpY2l0eSI6MSwidGltZVVuaXQiOm51bGwsImNhbmRsZVdpZHRoIjo0LjQyNTI4NzM1NjMyMTgzOSwidm9sdW1lVW5kZXJsYXkiOnRydWUsImFkaiI6dHJ1ZSwiY3Jvc3NoYWlyIjp0cnVlLCJjaGFydFR5cGUiOiJsaW5lIiwiZXh0ZW5kZWQiOmZhbHNlLCJtYXJrZXRTZXNzaW9ucyI6e30sImFnZ3JlZ2F0aW9uVHlwZSI6Im9obGMiLCJjaGFydFNjYWxlIjoibGluZWFyIiwic3R1ZGllcyI6eyJ2b2wgdW5kciI6eyJ0eXBlIjoidm9sIHVuZHIiLCJpbnB1dHMiOnsiaWQiOiJ2b2wgdW5kciIsImRpc3BsYXkiOiJ2b2wgdW5kciJ9LCJvdXRwdXRzIjp7IlVwIFZvbHVtZSI6IiMwMGIwNjEiLCJEb3duIFZvbHVtZSI6IiNGRjMzM0EifSwicGFuZWwiOiJjaGFydCIsInBhcmFtZXRlcnMiOnsid2lkdGhGYWN0b3IiOjAuNDUsImNoYXJ0TmFtZSI6ImNoYXJ0In19fSwicGFuZWxzIjp7ImNoYXJ0Ijp7InBlcmNlbnQiOjEsImRpc3BsYXkiOiJeR1NQQyIsImNoYXJ0TmFtZSI6ImNoYXJ0IiwidG9wIjowfX0sInNldFNwYW4iOnsibXVsdGlwbGllciI6NSwiYmFzZSI6InllYXIiLCJwZXJpb2RpY2l0eSI6eyJwZXJpb2QiOjEsImludGVydmFsIjoid2VlayJ9fSwibGluZVdpZHRoIjoyLCJzdHJpcGVkQmFja2dyb3VkIjp0cnVlLCJldmVudHMiOnRydWUsImNvbG9yIjoiIzAwODFmMiIsImN1c3RvbVJhbmdlIjpudWxsLCJzeW1ib2xzIjpbeyJzeW1ib2wiOiJeR1NQQyIsInN5bWJvbE9iamVjdCI6eyJzeW1ib2wiOiJeR1NQQyJ9LCJwZXJpb2RpY2l0eSI6MSwiaW50ZXJ2YWwiOiJ3ZWVrIiwidGltZVVuaXQiOm51bGwsInNldFNwYW4iOnsibXVsdGlwbGllciI6NSwiYmFzZSI6InllYXIiLCJwZXJpb2RpY2l0eSI6eyJwZXJpb2QiOjEsImludGVydmFsIjoid2VlayJ9fX1dfQ%3D%3D
Data, whatever reliable data is, can be a bad predictor?
“’It’s tough to make predictions, especially about the future’” Yogi Berra
On cinquo de mayo no one goes to Mexican restaurants they are too crowded!
That comment was so dumb when my eye skipped over your name I thought you were PeakIgnorance.
See Matthew 7:5
Our resident conservatives are now saying this uncertainty measure is soft data. Where you guys saying this back when Team Romney was abusing it?
http://rooseveltinstitute.org/what-economic-policy-uncertainty-index-really-telling-us/
pgl, it’s “soft” because it relies on not much more than a word count. If you can demonstrate a strong correlation between these soft data and economy activity (pick your measure), then it might be worth the great excitement. I’m more of the opinion… yeah, opinion… that this “uncertainty index” is more a measure of political bickering than economic uncertainty. It was highest under Obama and then peaked again when Hillary lost the election and the “resistance” meme kicked in.
Bruce Hall: Just for the record, regarding the monthly index, the second highest observation is associated with 9/11 and the fourth highest is Lehman. Those do not seem like mere “political bickering”, but you may differ in your view.
Ever wonder where we get some of those diffusion indices for economic activity? A lot of them are based on surveys…
Don’t be poking fun of Mitt Romney, he’s a “great American”. Mitt Romney says 47% of Americans are just a bunch of “damned lazy bums”.
https://www.youtube.com/watch?annotation_id=annotation_786897&feature=iv&src_vid=XnB0NZzl5HA&v=MU9V6eOFO38
Romney also had an investment in a firm that dealt in fetus tissue. How much more “All-American” and “traditional values” can you get than that??? . Romney gives all Mormons a big “warm fuzzy” deep in their hearts.
https://www.motherjones.com/politics/2012/07/romney-bain-abortion-stericycle-sec/
Oh, I forgot to clarify one thing……. It was DEAD fetuses and body parts that Romney’s investment dealt in. Don’t want to create any false impressions there on poor Mitt Romney.
Menzie Using equation 3 (i.e., using the log of the dependent variable) and HAC adjusted errors I come up with exactly the same coefficients, t-ratios and diagnostics as what you are showing. However, it looks like there was one order of autocorrelation remaining. The correlogram showed an AR(1) signature. I also ran the model through a sequential omitted variables test. Rerunning the model with one lag of the dependent variable and removing the election transition dummy, the Lehman dummy, the Persian Gulf war dummy, the divided government dummy improved the overall fit of the model. The adjusted R-sq goes to .561 and the residuals are unambiguously normally distributed (Jarque-Bera = 31.82). The CUSUM test is well within the boundaries. And there is no particular evidence of ARCH errors. The revised regression does change the coefficients, but not the overall picture. The Trump effect is still about 54% greater than the Obama effect.
@2slugbaits
Can you “do a bro a solid”?? You’re probably not like me, and using “freeware”. And I am going at a snail’s pace on this stuff because it’s been a long time since I used spreadsheets and Stats. But (you can use Excel as your example if you have that, it’s near enough to what I am using). How did you get the spreadsheet cells to kick out your Jarque Bera number?? I’m more interested in how you got your spreadsheet to kick it out than the math, but either way if you can help clarify on that I would be grateful.
Also, if you can give just one example of one of your OLS regressions with the “dummies” included I would be grateful as well (the cell inputs for the calculations) that would be great—-say for example one of these two ” 0.069DIVIDEDGOV + 0.449PERSIANGULFWAR “. If I just have ONE example of these I think I can decipher how to do the others. If you can’t that’s cool, eventually I’ll get it on “trial and error”.
I must have the math somewhere right, because when I did Jarque Bera on an old school calculator, dropping off some of the decimals I got 186, (on Menzie’s first HIstogram) which I think although 4 digits off would be somewhere in the ballpark. I just don’t know how to get the number to kick out in the spreadsheet.
I didn’t use Excel or any spreadsheet. I used dedicated econometric software.
But in rereading what I wrote I noticed that I had a typo. I should have said the residuals were unambiguously NOT normal. Normality is strongly rejected. The distribution is slightly leptokurtic, which is why I bothered to check for ARCH. Somewhat peaked distributions a oftentimes a warning for persistent volatility.
@2slugbaits
I think Menzie established the distribution wasn’t normal at the very top of his post. That’s why he went through the other iterations such as Huber. Thanks anyway.
Actually, Menzie’s 3rd regression did pass the normality check. Or rather, normality couldn’t be rejected at the 5% level of significance, although just barely.
slug
Do you really think it is proper to measure the President Obama effect over 8 years against just 15 months or even 1 month of the President Trump effect. To be clear, I do not think it is proper or apple to apple A fairer comparison would be the first 15 months of the President Obama first term v. the first 15 months of President Trump first term. But if you consider the first year of a term unfair because of carry over from a previous President then the 13 -15 month would be better. Other possibilities would just be the 15 month of each first term (Menzie has compared the single 15 month to other dates}.
If a predictive approach seems appropriate then a calculation of the President Obama effect of months 16 through 48 would have value as a measure the rest of President Trump term against.
Ed
Ed Hanson Do you really think it is proper to measure the President Obama effect over 8 years against just 15 months or even 1 month of the President Trump effect.
Why not? You don’t seem to have any problems with comparing the stock market’s performance over the first few months of Trump versus the last couple of years under Obama.
A fairer comparison would be the first 15 months of the President Obama first term v. the first 15 months of President Trump first term.
It’s not obvious (at least to me) why the first 15 months of a President’s term should be different from the last 15 months with respect to uncertainty. Remember, Menzie already included dummy regressors to handle exogenous shocks like Lehman’s, the Great Recession, the Iraq War, etc. Uncertainty is all about forward expectations; uncertainty is not about how long it takes for a President’s legislative accomplishments to take effect, which I suspect is what you have in mind when wanting to lag things by 15 months. Now it’s entirely possible that there could be some autocorrelation or persistence in uncertainty, which is why I included a lag of the dependent variable in my regression. But that’s not the same thing as expecting a 15 month “warm up” period from a new President. If anything a new President ought to be enjoying a honeymoon period, which you would think might dampen uncertainty, other things being equal.
In reading your posts I’m coming to the conclusion that you don’t appreciate why Menzie included dummy variables. The point is to discriminate the level of uncertainty that is due to a particular President versus the level of uncertainty that is due to other factors. Making those kinds of discriminations is exactly the point of doing a formal regression rather than just looking at simple averages.
Slugs
The last 15 months of President Obama compared to the next and first 15 months of President Trump is a reasonable comparison as a measure of the change in economic approach from one that has been adapted to (Obama) compared to a new approach (Trump) which, not surprising, brings on uncertainty.
A comparison of first 15 months of each term is a different measure. It is how a new economic approach of each new President is being adjusted to. Uncertainty is product of change more than it is a measure of type of change.
Ed
Ed Hanson: That’s why I included a dummy for elections and transitions. When a new president is installed, the dummy variable takes a value of 1 to account for the transition for the subsequent 12 months. You really should read the variable descriptions and understand what a dummy variable does before debating about inference regarding regression results.
two comments
Change does not automatically lead to uncertainty. not if the change has a coherent plan. Coherence and Trump are polar opposites however
Those who think the data is ‘crap’ ( a highly technical term) have yet to provide any evidence for that.
Not Trampis, I provided the evidence earlier. Self referencing and circular data fit your ( a highly technical term), ‘crap’. Which might also describe your reading comprehension. Not personal just kidding.
tramp
Also two comments.
Please provide an example of a coherent plan and its time period for comparison of uncertainty.
Assuming ‘crap’ is a quote, I have search posts for more than a month and Moses you are up first with using the word most of the often. And easy response, not once did you use the word in connection with data Slug you up next with use of the word three times, but never in connection with Menzie data or uncertainty. And that leaves it to me and my use of the word once. Its use had no connection to data.
tramp, if the word was used by anyone in connection to Menzie data it is more than a month ago and enough for searching. Please link or remove the quote marks.
Ed
“Please provide an example of a coherent plan and its time period for comparison of uncertainty.”
Huh – that is why you guys did not bash Team Romney for their abuse of this index. They never provided a coherent economic plan back in 2012. Good to know!
Sorry Cor rev that your ‘evidence does not pass first muster. I was hoping for something substantial.
Not Trampis, of course garbage data as the source wouldn’t pass your muster, because it is negative to your views.
Menzie,
I’ve found an error in your data set. You use the midpoint method in order to define 0-1 series for NBER recessions as I believe, so there ought to be 1 instead of 0 in Jul-1990. Of course this one observation does not change the picture dramatically. I enclose the outcome for the log-epui version of the model as well as the Wald-tests for Trump against various episodes. I used the trough method for NBER recessions here, so I do not count the peaks, that is the get 0 instead of 1 as in the midpoint method. Thanks for an inspiring piece of research. Trump is special indeed… Best!
Link to the results: https://drive.google.com/file/d/1mcq-ceRfw0cvzQiTO8OyszI2VeD1yKbu/view?usp=sharing