Back in mid-December, Political Calculations asked if California was in recession. The release of April state-level employment figures provides an opportunity to revisit this question — it’s likely no recession occurred, and is currently not occurring.
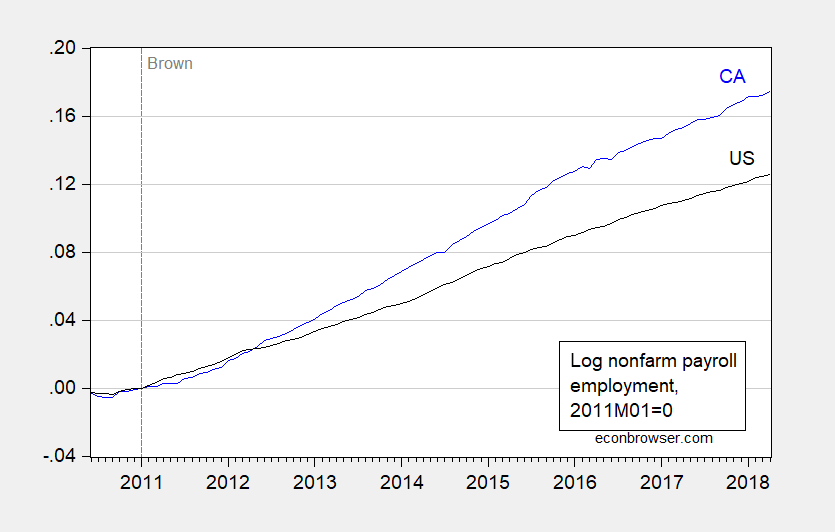
Figure 1: Log nonfarm payroll employment for California (blue), and for US (black), normalized to 2011M01=0. Source: BLS, and author’s calculations.
Note that California has cumulatively outpaced the Nation by 5% (log terms) since Governor Brown took office in 2011M01. California’s Department of Finance April forecast projects continued growth. The DoF forecast is based in part on IHS’s national forecast (see description here), and the Department’s in-house macroeconometric model. For a check, I include the UCLA Anderson Forecast’ March projections (approximate, as I inferred from the discussion).
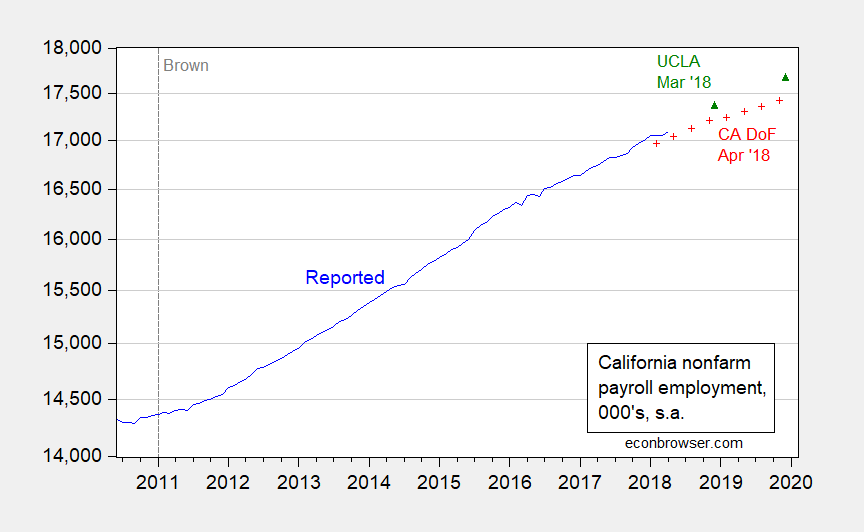
Figure 2: California nonfarm payroll employment as reported (blue), California Department of Finance April forecast (red +), UCLA Anderson Forecast from March (green triangles). Source: BLS, CA DoF, UCLA Anderson Forecast, and author’s calculations.
Of course, there are biases and incentives associated with all organizational forecasts. I also plot the forecast from a simple ARIMA(1,1,1) on log California nonfarm employment.
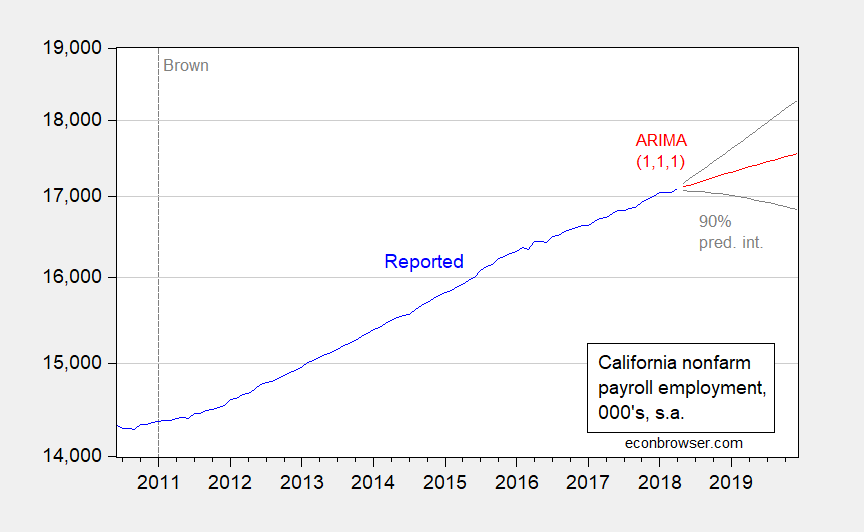
Figure 3: California nonfarm payroll employment as reported (blue), dynamic forecast from simple ARIMA(1,1,1) on log employment, estimated over 1990M02-2018M04. Source: BLS, and author’s calculations.
Using a relationship between the first differenced log coincident index and log nonfarm payroll employment for California, and forecasted coincident index (using the leading index) leads to a forecast through 2018M09 very slightly below that shown in Figure 3).
What about previous downward blips in employment? From Wells Fargo (5/18):
Recent Declines Revised Away as California Adds 39,300 Jobs in April Hiring got back on track in April, as employers added 39,300 jobs. Moreover, job growth was revised higher in February and March, which now both show modest gains of 1,200 jobs and 5,400 jobs, respectively, compared to modest net declines reported previously. Every major industry added to payrolls during the month. California’s unemployment rate also ticked down 0.1 percentage point to a new record low of 4.2 percent in April.
It is of interest that some constraints are being approached:
California’s agricultural regions tend to have much higher unemployment rates as much of the work in those places is seasonal, resulting in higher seasonal and frictional unemployment. Despite these challenges, unemployment rates even in California’s agricultural markets are reaching new cycle lows. El Centro, which has long had the nation’s highest jobless rate, has seen a dramatic drop during the past year, largely as its labor force shrunk. The region’s unemployment rate is still astonishingly high at 17.1 percent, but agricultural-related businesses are also having a harder time finding workers.
Hence, the Administration’s program of targeting undocumented workers seems to have the effect of increasing costs in the agricultural sector, perhaps as desired.
It is true that California labor force and employment as measured by the household survey (CPS) have both plateaued; however, as I have noted previously, the use of household survey based series at the state level alone to infer business cycle patters is contra-indicated. (Moreover, I am unaware of an academic literature which links state level labor force participation rates (LFPRs) to state level business cycles.)
Employment in CALI is outpacing the rest of the nation. This is interesting given the often heard spin from PeakIgnorance that people are fleeing CALI. If Peaky were right, simple arithmetic would say that its employment to population ratio would be at the highest level ever seen!!!
Of course PeakIgnorance is lying to us as every source I have seen shows CALI’s population has reached almost $40 million.
We await the next parade of lie from PeakIgnorance as he evades sales taxes!
There always is churn in California employment. High skills/Income types moving in and low skill/income types moving out. I remember back in the day, 1960’s, my father in law told me of one of his workers who moved to Arizona because less expensive housing. After the move they found out jobs were scarce and such low pay they could not save enough money to move back to California. Reminds of the inverse of the Eagles song Hotel California except you can leave but you can’t come back.
Total nonfarm employment in CALI has passed 17 million:
https://fred.stlouisfed.org/series/CANA
Impressive for a state that employs a lot of farm workers!
Employment to population rate by state!
https://www.bls.gov/news.release/srgune.t02.htm
CALI’s is less than 60%. Yes people are moving there (Peaky does lie a lot). And people like to retire in such a beautiful state, Plus a lot of excellent schools. Etc. Lots of reasons why an employment to population rate less than 60% is not necessarily a bad statistic. But the CALI haters will spin this as a bad thing. It is what they do.
I also see high employment to population ratios in Trump nation states which is likely an indication people are fleeing Hickville USA. Ratios can be high for two reasons including the denominator being low.
@ Menzie
You know I sometimes dislike always coming across as the cynical negative guy, but you know, it’s what I see before my eyes when looking “out there”. But as much as I love empirical data, intellectual conversations/dialogue/written-word and graphs, and I do love those things—you know what I really think about California?? I think people are going to discover what a great leader Jerry Brown has been (Churchill?? NO, but pretty damned good) when he retires from the Governorship. When jerry Brown is absent only then will Californians realize what a great job he has done. And knowing people as I do, I doubt the replacement will be half as good, and more likely detrimental to the progress Jerry Brown has made.
pgl, admittedly, this is a few years old and things could have changed dramatically in the past few years… but probably not. https://www.census.gov/dataviz/visualizations/043/
It looks as if California gains about 1% population per year. Neighboring states are gaining population at a much faster rate. Texas gained 1.5-2% per year. This source shows California growing at a slower rate in the past few years: http://worldpopulationreview.com/states/california-population/
Regardless, California has a formidable economy for a number of reasons. The most obvious is the growth of the silicon valley industries. But as pointed out in other posts on this subject, California has a big problem in income inequality. The rich are very rich and the poor are very homeless. https://www.cnbc.com/2018/03/12/us-states-with-the-highest-levels-of-income-inequality.html
Perhaps California’s attitude toward illegal immigrants is partly to blame for this inequality: https://www.ocregister.com/2015/08/09/progressive-policies-drive-more-into-poverty/
By United Way’s calculation, roughly one in three Californians can barely make ends meet, despite the state’s relatively generous transfer payments, subsidies and general assistance. Latinos and African Americans, as one might expect, fare worse, but roughly one-in-five non-Hispanic whites and 28 percent of Asians also are deemed struggling.
Is California in a recession? No.
Is California’s population growing? Yes.
Does California have a strong economy. For many.
Does California have a poverty problem? Yes.
California also has a Proposition 13 problem. Who is responsible for that? My guess is subscribers to the Orange County Register.
2slug,
Here is Michigan, we have something similar: http://www.mlive.com/education/index.ssf/2014/04/a_brief_history_of_proposal_a.html
There is one section of this article that is not quite accurate:
“Over the years, increases in school funding were distributed in a way that gave double increases to lower-funded schools in an attempt to continue to close the funding gap among districts. In 1995, the lowest-funded schools received $4,200 per pupil and higher-funded schools received $6,500 per pupil. By 2013-14, the lowest-funded schools reached $7,026 per pupil while higher-funded schools received $8,049 per pupil.”
It implies that “poorer” districts receive less funding than “richer” districts. When one looks at the poorest, bankrupt district… Detroit Public Community Schools District… one sees that it receives, in total from all sources, over $15,000 per student. A well-off suburban school district, Rochester Public Community Schools District, receives just under $13,400 per student. Detroit residents contribute just over $600 per student from their taxes; Rochester residents contribute over $4,000 per student. http://www.mackinac.org/depts/epi/fiscal.aspx .
Our local school district just convinced property owners to pay an extra 1 mil toward school maintenance… a hundred or so dollars per year for many. While there are detractors of Proposal A, mostly from areas with higher property values that receive less from the state than districts with lower property values, the system seems to be working and property taxes have remained in check.
Perhaps California politicians are not as astute as Michigan politicians. More on Michigan here: http://msue.anr.msu.edu/news/a_refresher_on_proposal_a_and_local_property_taxes
Bruce you are arguing about inequality like you are a socialist!