Some analysts continue to infer short term trends solely based on household labor market series compiled at the state level. Here are two pictures showing why focusing on the household over establishment could be misguided.
Here are various vintages of the November release for California household/civilian employment series.
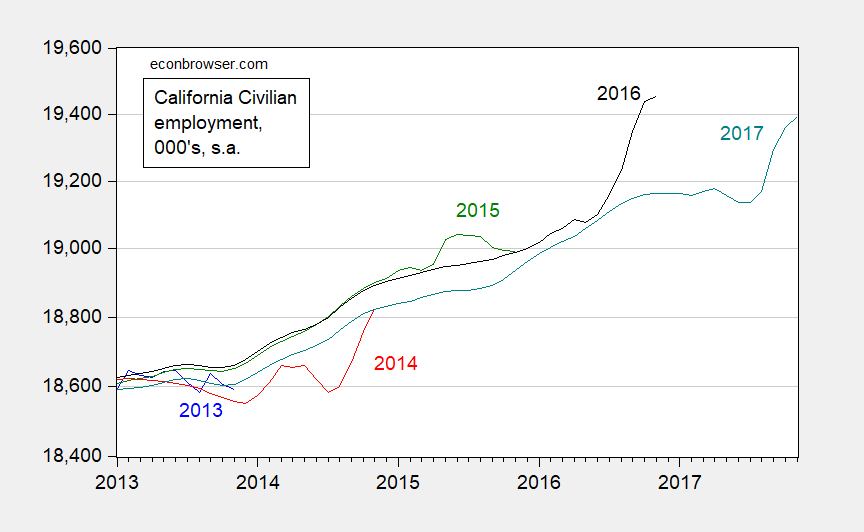
Figure 1: Civilian employment from household survey in California, from November 2013 release (blue), November 2014 release (red), November 2015 release (green), November 2016 (black), and November 2017 (teal), all seasonally adjusted. Source: BLS via ALFRED and FRED.
For comparison, here is a corresponding picture of the establishment series.
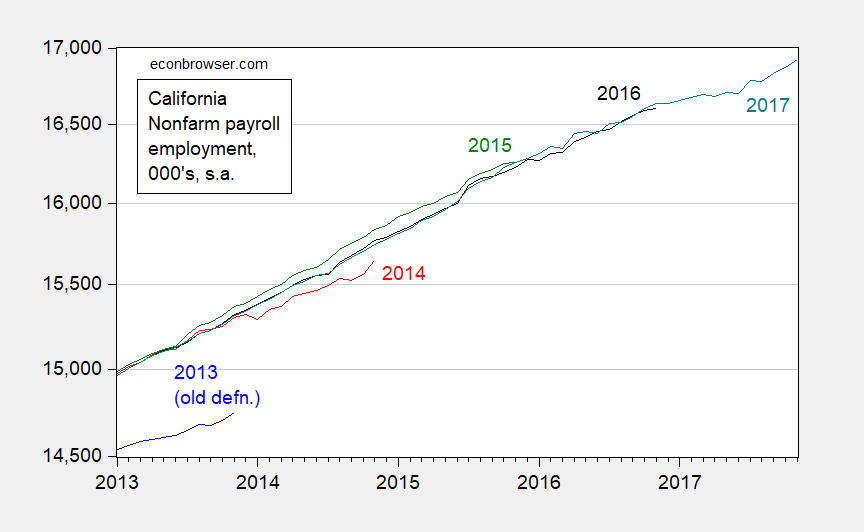
Figure 2: Nonfarm payroll employment from establishment survey in California, from November 2013 release (blue), November 2014 release (red), November 2015 release (green), November 2016 (black), and November 2017 (teal), all seasonally adjusted. Source: BLS via ALFRED and FRED.
In general the revisions are smaller, except in the 2013 to 2014 series when a redefinition of nonfarm workers occurred. Even then, the trends are more apparent and less subject to reappraisal, when using the NFP series. The reason why the civilian employment series at the state level is particularly prone to measurement error is explained by Justin Wolfers: the sample at the state level is relatively small. Apparently, the impact is non-negligible, even for a state as large as California.
One individual has tried to tease out trends by appealing to twelve month moving averages. This might mitigate the problem, but in my view, insufficiently so if one is trying to detect trends.

Figure 3: 12 month trailing moving average of Civilian employment from household survey in California, from November 2013 release (blue), November 2014 release (red), November 2015 release (green), November 2016 (black), and November 2017 (teal), all seasonally adjusted. Source: BLS via ALFRED and FRED, and author’s calculations.
None of the above should be construed as suggesting that one should ignore the household series. However, one should have a clear understanding of the magnitude of the measurement error before relying almost solely on these data as indicators of labor market trends.
Previous installments of the “Beware” series, for Wisconsin and Kansas.
Isn’t this where a Walkerite points out how and where Wisconsin is outperforming California, especially in current unemployment data?
No matter that it’s an apples to oranges comparison (if that) since California has about 7X more people and is about 3X larger geographically.
Or that California has far more distinct economic regions, some of which are similar to Wisconsin in population and have similar to lower unemployment numbers.
Nah, it’s California, so it must be terrible. Why, the state is $400-500 Billion in debt and has a debt to state GDP ratio of about 21% (GDP at or near $2.5Trillion)!
Please, don’t disappoint. (Yes, it is more expensive to live here. No, not every home lists for more than million. It’s chilly outside tonight, about 45. Should be about 65 tomorrow.)
Let the comparisons begin.