The following graph compares average tariff levels across countries.
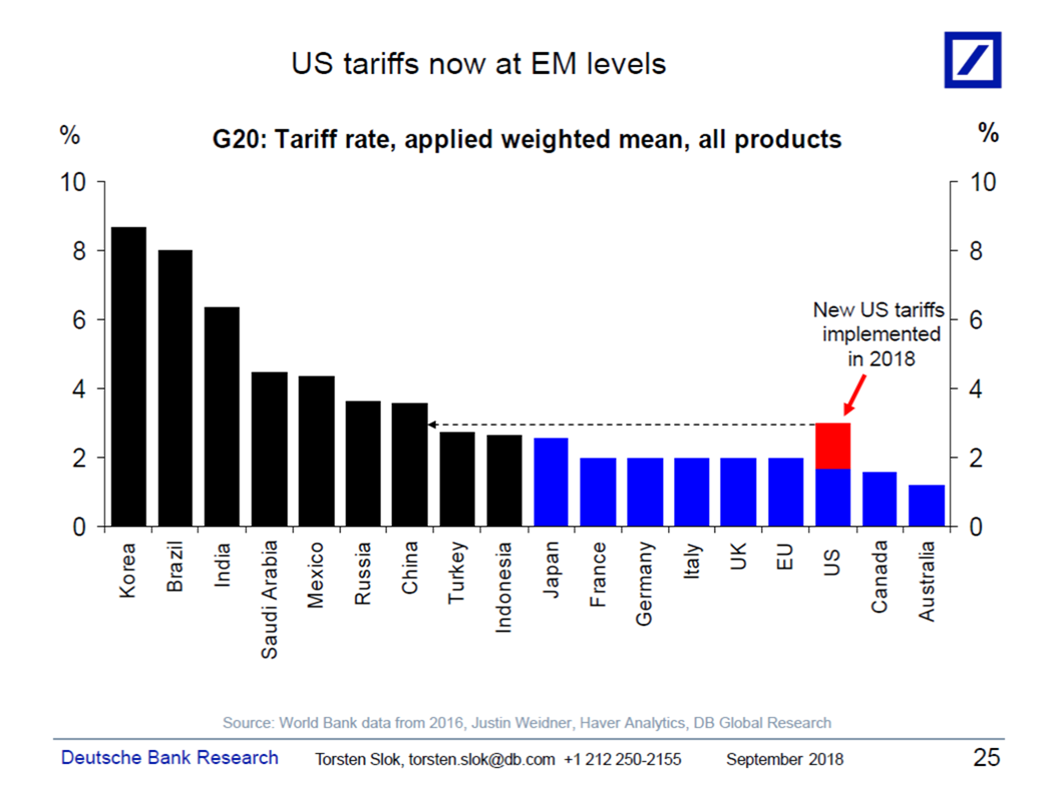
One can take comfort from the fact US tariff rates are historically low.
I have two observations:
- We live in an era of global value chains, so that the value added has been chopped up and split across nations. In this context, a tariff of 10% on final value is a lot more than 10% on value added.
- This shock to global value chains comes on the back of an already stretched logistics network.
The latter point is highlighted by the following graph:
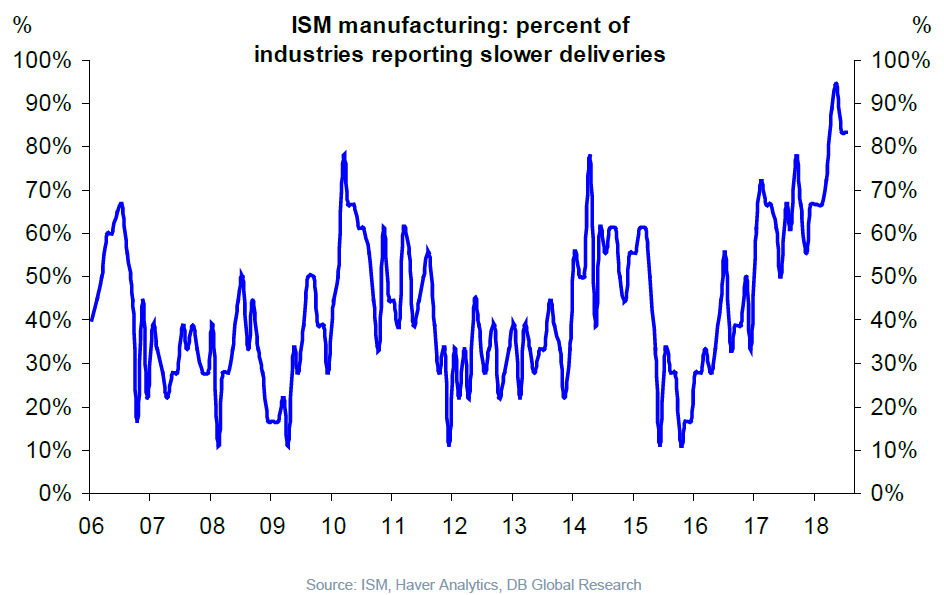
The latter is perhaps a temporary phenomenon, likely to end when the economy goes into recession. However, the former is likely more persistent.
Global value chains have been built up over decades; rejiggering these chains to accommodate tariffs of indefinite duration is sure to be disruptive, possibly inflationary (although that depends on monetary policy).
One of the guest posts here led me to a Youtube link. Maybe it was about 2 months ago?? I wanna say it was connected to that warm-hearted and sharp-minded East-Indian gentleman [edited], but I think it was some other guest poster here. But when I visited that Youtube link it had a great link in the video explanation part (right under the video) that had a link to a FREE DL of an IMF (or Worldbank??) book that explained TONS of stuff about “GVC”. Because I have so much gunk to read already and I am lazy I haven’t read it all yet. But if you guys remember that post (it was one of the guest commenters) and you can then find his speech which has that FREE GVC book link just under the video controls,
BTW, I read the NYT review for the NEW Murphy Brown show. I thought the NYT reviewer was pretty harsh on the show and the humor. Now, I consider myself fairly neutral as I very rarely ever watched Murphy Brown in it’s first incarnation or first rendition. I went in fairly neutral. I give the show a strong B+ by any measure, and the “pilot” show (if we can call it that for the 11th season) measures quite well against most of the comedy on in recent years. As in, do you ever watch Tim Allen’s show “Last Creepers Guy Standing”?? Horrid jokes and 1980’s style canned laughter so even the 3 idiots watching can be aware the writers meant it as a joke. “We” know there isn’t much comedy to compare to the golden days of “Frazier” and “Seinfeld”, but compared to most of it, I highly recommend turning on and watching Miss Candice Bergen. She doesn’t miss a comedic beat and her returning cast (see I filtered out “old” there, because I’m….. nevermind) also do more than carry their weight. I highly recommend giving it a whirl.
https://www.youtube.com/watch?v=RHOVgaEaO4g
Does the tariff chart also include trade barriers on agriculture goods? If so, it would be interesting to look at the average effective tariff rate by country excluding agriculture goods. Let’s not forget that Japan and the EU have just recently signed a major free trade agreement.
https://thediplomat.com/2018/07/largest-bilateral-free-trade-agreement-japan-eu-conclude-bilateral-economic-partnership-agreement/
I take your point, but I wonder if delivery times would be fairly slow without tariff actions to date. After all, ISM new orders are nothing of 60 and have been since January 2017. Of course delivery times will lengthen. Demand is running so strong that it is take factories more time to move product out the door. It will be interesting if delivery times remain long if new orders and production slip.
Neil: not saying deliveries are slow because of tariffs; rather tariffs might exacerbate delays when implemented as importers look for different suppliers.
Historically, the deliveries index is a great leading index of interest rates.
Rates, both long and short rise when it is over 55.
Longer delivery times and rising interest rates. Not where you want to be.
A long time ago my office did a study and found that production lead times for Army procurements were pro-cyclical; i.e., vendor lead times fell when the economy was weak and rose when the economy was strong.
http://worldoutofwhack.com/2018/09/28/most-important-chart-for-investors/
Professor Chinn,
You mentioned inflation and monetary policy above. I wonder if you have an interest in a summary tutorial on monetary policy and inflation if not here, perhaps in a future entry. I notice that M2 annual percentage growth has varied substantially over the past few years. The Y/Y percent growth at 2016 m10 was about 7.6% dropping to about 3.9% Y/Y for 2018m09.
I was surprised to see that interest rates paid on required reserves and excess reserves is currently at 2.2% on an annual basis. Seems like reduced incentives for banks to take on risky loans.
AS: See this post for a Phillips Curve interpretation.
Thanks,
I used the relationship of GDPC1/GDPC96 to adjust FRED series GDPPOT. Using this adjustment, it looks like GDPC1 may have surpassed GDPPOT as of 2018Q2. I have not tried to work-through all of the linked post, but I wonder, if GDPC1 surpassing GDPPOT may change the inflation outlook.
However, looking back at Professor Hamilton’s post of May 28, 2006, an update of the ten year relationship of M2, and nominal GDP seems to have totally broken down. Adding the ten year average change in CPI to an updated chart as of 2018Q2, inflation seems to continue to trend downward. Nominal M2 shows a ten year average of about 8.2%, nominal GDP 3.8%, and CPI about 1.6% (assuming correct calculations).
Most perplexing to a hobbyist.
AS: To be honest, I know very few academic macroeconomists who believe the quantity theory of money holds for small nominal monetary shocks (Zimbabwe is different). In its literal form, we know velocity is not constant. Moreover, trends in financial technology and regulations change the M/(PQ) ratio and induce trends in these relationships. Hence, I think one has to look to alternative means of predicting inflation, at least in the short run.
Professor Chinn,
If you update the linked entry on GDP Gap and Inflation, would you consider providing the data and the EViews models?
If I understand the scatter diagram, you are using dlog(cpiaucsl) and d(log(gdppot) – log(real GDP)(-1)). My scale on dlog(cpiaucsl) seems to be off. I have tried to update the model to use the GDPC1(12) and an adjusted GDPPOT(12), so the data is a bit different, but the main problem seems to be the scale on dlog (cpiaucsl).
Also, I am not familiar with how to use the 0.7 bandwidth with regression. I assume this relates to the regression curve. Probably would need some additional explanation on the Phillips curve model also.
Given the issues related to reduced tax receipts and perhaps GDP starting to exceed potential GDP, inflation may be ready to surprise us on the upside (question not an assertion).
Thanks,
AS: I think it’s problematic to adjust the potential GDP series measured in Ch2009$ to Ch2012$ by using the ratios of the deflators, because the wholesale adjustment of price deflators probably implies a revision to underlying real GDP. That’s why I’d use Ch2009$ thru 2018Q1.
I wouldn’t use d(log(gdppot))-log(real GDP(-1)); I would use log(GDPPOT)-log(real GDP(-1))… (also be sure to recognize if I’m using d(log(cpiaucsl)) I should’ve converted to annual by multiplying by 4.
Thanks,
I will redo the work. Should have realized that I should multiply the CPI quarterly data by 4 to show an annual estimate. I guess I got distracted trying to understand the methods used. I also now see the regression line adjustments in the Options area for including a regression line. I thought you had used a forecasting equation model.
You Yanks should be copying us down under
Looking at the graph can we call this a “pattern”??
https://www.frbatlanta.org/cqer/research/gdpnow?item=71FCCCF0-A8A8-42EE-98E8-D770B9AB9936
Of course I have thought for awhile now the actual GDP numbers are way closer to 2%. Frankly it’s hard for me to believe GDP is even much higher than 1.5%. I think the real domino waiting to fall here is the stock market with valuations in the Harry Potter witch world of realism, when you add that to economic growth way lower than what we are being quoted now, it makes the potential for a big hit to markets sometime before the end of 2020 pretty damned high. This is conditional on no large infrastructure packages inducing a kind of “artificial growth” between now and spring 2020.
This prediction brought to you by “Goofball Advisers LLC”
“We live in an era of global value chains, so that the value added has been chopped up and split across nations. In this context, a tariff of 10% on final value is a lot more than 10% on value added.”
True. Also true = a tariff on an intermediate good (steel) can mean a negative tariff on the final product (cars).