The CBO recently released long term projections for Federal budget variables, including debt. These projections rely upon the assumed path of interest rates. Here, there is considerable uncertainty. Figure 1 presents the 10 year Treasury yield, and CBO projections at various dates.
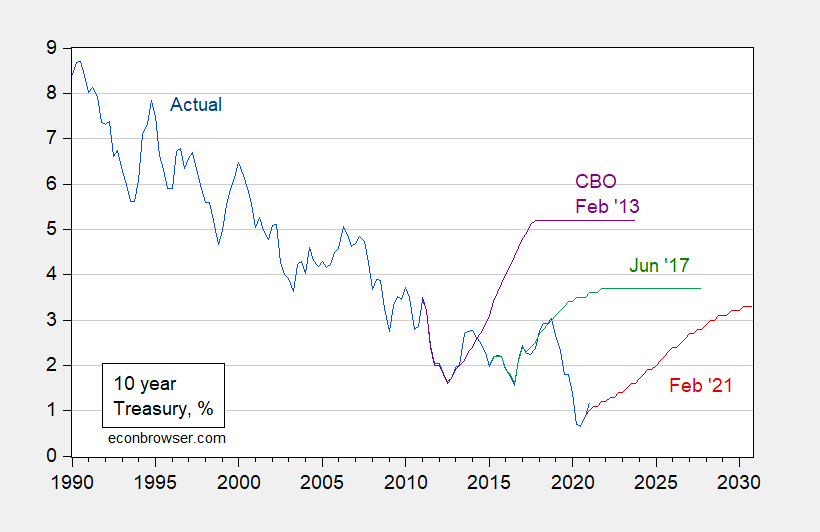
Figure 1: Ten year constant maturity Treasury yields (blue), CBO projection from February 2021 (red), from June 2017 (green), and from February 2013 (purple), all %. Quarterly data average of monthly, except for 2021Q1, which is average of January and February. Source: FRED, CBO, and author’s calculations.
Gamber (CBO, 2020) lays out the economic rationale for the projections (demographics, international forces, etc.). He notes:
Modeling and forecasting interest rates also presents many challenges that contribute to the uncertainty about the path of interest rates, especially over the long term. Three challenges, in particular, contribute to the uncertainty of the projected path of interest rates over the next 10 to 30 years. The first challenge is that it is difficult to measure and forecast independent movements in the various factors affecting interest rates. For example, the research literature identifies demographic changes as an important factor in determining interest rates. But demographics (the aging population and increased life expectancy) affect interest rates through a number of different channels—the saving rate, the labor force participation rate, and possibly the rate at which people discount the future. Forecasting the independent influences of those channels is challenging and contributes to the uncertainty in interest rate forecasts.
A second challenge with forecasting interest rates over the next 30 years is that the ratio of debt to GDP in the United States is projected to rise to unprecedented levels (Congressional Budget Office 2020a). The peak ratio of debt to GDP over the past 100 years—120 percent—was reached just after World War II. In CBO’s long-term budget projections, that ratio exceeds 200 percent. It is difficult to anticipate how the economy and financial markets might respond when the debt-to-GDP ratio reaches unprecedented levels. CBO’s method for forecasting interest rates implicitly reflects the assumption that historical relationships between rising debt and interest rates will remain unchanged as debt rises to those unprecedented levels. But if the increase in debt leads to an erosion of confidence in the United States’ ability to repay its debt or to an erosion of the dollar’s status as an international reserve currency, real interest rates could increase more than CBO anticipates. The challenge of modeling how the economy will respond to rising debt as it reaches unprecedented levels adds to the uncertainty of CBO’s interest rate forecast.
A third challenge with modeling and forecasting interest rates over the long term is separating temporary movements in interest rates from persistent or permanent movements. Over the past 150 years, real interest rates have been subject to sudden and persistent shifts (see Figure 4). A challenge with any forecasting method is to separate transitory from persistent shifts in interest rates. CBO addresses that challenge by choosing a historical benchmark period—1995 to 2004—over which the agency estimates monetary policy was neutral, on average.
The long-term decline in interest rates that occurred during the latter half of the benchmark period is interpreted as temporary rather than persistent and thus does not affect CBO’s projections of interest rates. CBO expects that interest rates would be the same from 2046 to 2050 as they were on average from 1995 to 2004 if during that projection period the values of the factors that are inputs into CBO’s projections equaled their averages over the 1995–2004 period. The difficulty in assessing whether omitted factors related to trends within the benchmark period would persist into the projection period contributes to the uncertainty of CBO’s projections.
By the way, predicting interest rates has been a challenging task for all sorts of forecasters. Consider Figure 5 from Gamber (2020), which show Blue Chip forecasts relative to real interest rate outcomes.
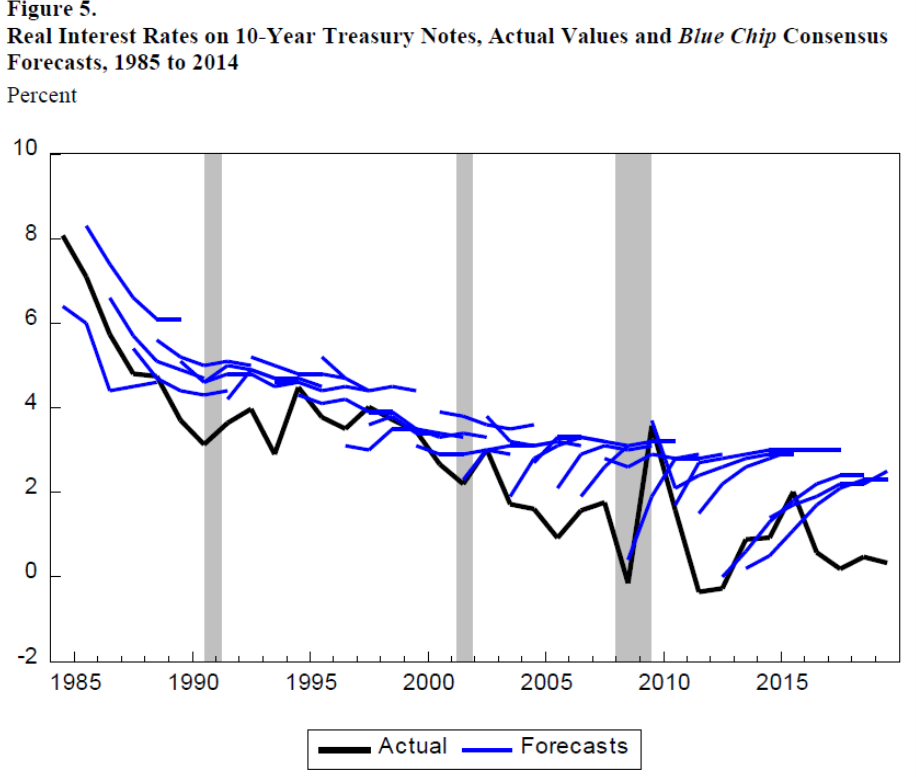
Source: Gamber (2020).
In other words, Blue Chip surveyed economists have on average been predicting mean reversion for the past 35(!) years.
For Jim’s views on long term real interest rates, see this post.
“CBO expects that interest rates would be the same from 2046 to 2050 as they were on average from 1995 to 2004 if during that projection period the values of the factors that are inputs into CBO’s projections equaled their averages over the 1995–2004 period.”
CBO projects that interest rates will be the same if everything is the same, but if they are different, interest rates will be different. Who’s paying these guys?
CBO does reasonably well when they stick to simple “revenue in” and “spending out” analyses (without the magical dynamic scoring). But they should be completely ignored for their crystal ball gazing about interest rates, inflation rates or GDP growth.
For a number of years I kept an analysis of the FOMC’s SEPs and I seem to recall that their performance wasn’t impressive. The interesting thing with the committee is that projections are to be based on “appropriate monetary policy”. Im not sure the larger implication of inaccurate projections – poor forecasting or poor monetary policy?
https://fred.stlouisfed.org/graph/?g=tKur
January 4, 2020
United States Employment-Population Ratios for Men and Women, * 2020
* Employment age 25-54
https://fred.stlouisfed.org/graph/?g=wEsl
January 4, 2020
United States Employment-Population Ratios for Men and Women, * 2020
* Employment age 25-54
(Indexed to 2020)
https://fred.stlouisfed.org/graph/?g=x6ix
January 4, 2020
Employment-Population Ratios for White, Black and Hispanic, * 2020
* Employment age 16 and over
https://fred.stlouisfed.org/graph/?g=x6hN
January 4, 2020
Employment-Population Ratios for White, Black and Hispanic, * 2020
* Employment age 16 and over
(Indexed to 2020)
https://fred.stlouisfed.org/graph/?g=r5Wc
January 15, 2018
5-Year, 5-Year Forward Inflation Expectation Rate, 2017-2018
https://fred.stlouisfed.org/graph/?g=mjbD
January 15, 2018
5-Year, 5-Year Forward Inflation Expectation Rate, 2007-2018
The paper by Edward N. Gamber is a must read.
“A third challenge with modeling and forecasting interest rates over the long term is separating temporary movements in interest rates from persistent or permanent movements … The long-term decline in interest rates that occurred during the latter half of the benchmark period is interpreted as temporary rather than persistent and thus does not affect CBO’s projections of interest rates.”
Maybe I missed this but why do they dismiss the possibility that the decline is not a permanent movement?
Off topic a bit but bear with me. The NYTimes is reporting on communications between the Proud Boys and the Trump White House just before 1/6:
https://www.nytimes.com/2021/03/05/us/politics/trump-proud-boys-capitol-riot.html
But that they coordinated this attack should be a surprise to no one.
There is an interesting article in the March 6-7 issue of the WSJ, “Baby Bust Effects Could Last Decades”, page B12.
The article links birth rates to future interest rates. I assume that fewer people mean lower demand to borrow money and thus less pressure on interest rates resulting from decreased population growth. The article states, a lower fertility rate “…means that any enduring drop in births should suppress bond yields [on bond maturities of 20 years or more] …in the very long term…, [and] …[yields] will remain indefinitely lower compared with their pre pandemic levels”, due to the current lower fertility rate compared to pre pandemic fertility rates.
The article cites a 2016 Federal Reserve and a 2018 Bank of Japan study relating previous drops in fertility rates to subsequent drops in interest rates.
And that explains how you could have a $1.9 trillion stimulus on a recovering economy with no one even mentioning how we are going to repay it. It is treated as free money.
To quote myself from four years ago:
Like Japan, the US now runs structural fiscal deficits, even at the top of the business cycle. These deficits are coming in higher than forecast, just as America’s 65+ age cohort is set to increase by half to 2025. The Obamacare repeal and replace dilemma reflects just this tension. On the one hand, ‘compassionate conservatives’ – and voters – want universal healthcare coverage. On the other hand, the funding for such coverage is not readily available from tax revenues. Thus, the US social safety net appears to be at a turning point, with enormous pressures to solve the problem by resorting to ever-increasing debt. If inflation and interest rates are low, why not borrow more? That’s what they did in Japan.
http://www.prienga.com/blog/2017/7/20/japans-lost-century
No one – I repeat no one cares about your previous babble. And I doubt you will write a coherent thought about this. Try reading Krugman’s latest (I provided a link). Sensible and a touch of humor too. Two things you lack.
What is really funny about your stupid rant as a comparison to the US today is your whined that Japan had low interest rates but you are now doing Chicken Little over rising interest rates. Yes – a know nothing fool like you does tend to be incoherently all over the map. And if you think the US is about to have weak economic growth – almost every economic forecaster suggests just the opposite.
Like I said – your rants are both incoherent and utterly worthless.
We will repay by issuing new debt, so rolling it over. As always what really matters is the burden of the interest payments on the debt as percent of GDP, which is well below where it was 30 years ago. Of course this is a major reason why what happens to interest rates is important, aside from rising interest rates probably hurting some asset markets, if not necessarily the real economy all that much: the burden of the debt will rise if interest rates rise and stay up.
Wasn’t demographics a them of Steven Kopits which he claimed no one was paying attention to. Funny thing – now he is not paying attention as he is off in oil price shock and housing bubble chicken little land. One would think such insanity would not make it to an economics blog but it does.
Slower population growth implies a higher saving rate (greater demand for longer duration assets) and more demand for safe assets. Long Treasuries – a flat curve.
The actual (blue line) has already blown through the forecast (red line). I think it will be back around 3% by year end. That’s the difference between suppression and a recession.
Blown through? Could we tone down the jingoist crap and speak English? Suppression and recession? Utter gibberish.
The 10-year nominal interest rate = 1.54% where it was back in Feb. 2020. I bet everyone on Wall Street is having a real chuckle that you pretend to be in the forecasting game. Maybe they are reading your blog to see where suckers are investing so they can sell short.
CBO projection from February 2013 (purple) was initially “blown through” but actual rate too. Did interest rates back then continue to rise to well above the CBO forecast back then? Learn to read a graph. Damn!
Kopits is so concerned about repaying the $1.9 trillion relief package.
That’s easy to fix. A one-line bill. Repeal the Trump tax cuts for the rich. Done.
YEP!
Will that fix it? I think that tax cut was maybe 1.5% of GDP. The total covid package is 14% of GDP. And keep in mind the budget is running hefty structural deficits in addition to the stimulus package. And that was at the top of the business cycle. This hole is a good bit deeper than you think it is. But again, demographics! A structurally declining and low interest rate is a good reason to borrow gobs of money.
And that’s what we’re doing.
One-time expenditure v. continuing flow – I guess you never learned to make that distinction either.
Of course anyone who knows basic finance would do a present value analysis of the expected future tax revenues from 1.5% of GDP v. this one-time expenditure. But we get it – you flunked Finance 101. So hey!
“The total covid package is 14% of GDP.”
What just passed was $1.9 trillion as compared to GDP = $21.5 trillion. Let’s see my calculator says the ratio is only 8.84%. Now maybe you are including what got passed last year but then one would ask you to write more clearly. Oh wait – you flunked 1st grade grammar too.
Menzie in his most recent post noted the 2020 COVID spending alone was $4 trillion. If Princeton Stevie is summing that and the recent $1.9 trillion then this complete incompetent thinks 5.9/21.5 = 14% (hint it does not).
Yes boys and girls – anyone who would pay Princeton Stevie’s shop for consulting is an utter fool.
Most recent CBO scoring for the Trump’s TCJA was an increase in the debt of $1.9 trillion. Curiously, that happens to be exactly the cost of the American Rescue Plan Act.
Republicans want to spend money on rich people. Democrats want to spend money on not rich people. Seems pretty obvious.
10-year effect which understates the long-run effect unless this tax give away for the rich is repealed by the end of this 10 year time frame.
Of course the $1.9 trillion in spending is a one-shot deal. But don’t tell Princeton Steve that as the real world is going to take down his latest Chicken Little frenzy.
Can anyone explain why CBO thinks the debt ratio affects the interest rate? They seem to think it reflects the creditworthiness of the US. Seems a bridge too far.