Industrial production figures were released today, showing a rebound in March. In the context of key macro indicators followed by the NBER Business Cycle Dating Committee:
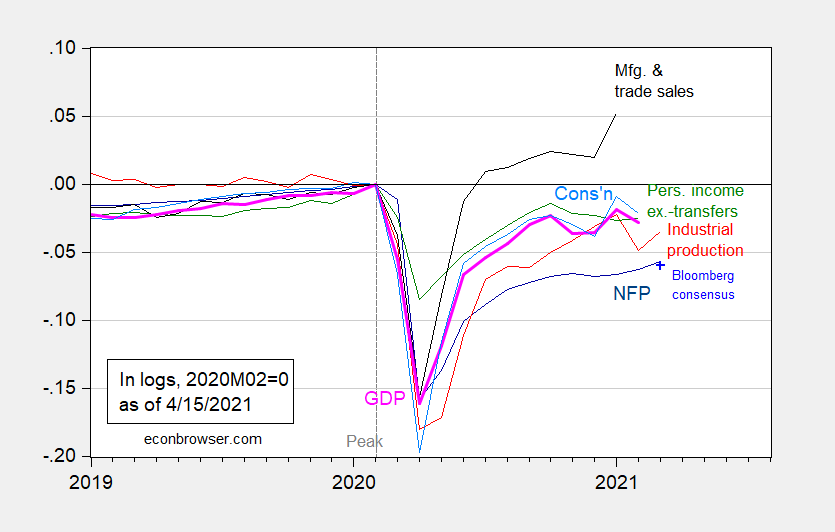
Figure 1: Nonfarm payroll employment from March release (dark blue), Bloomberg consensus as of 4/1 for March nonfarm payroll employment (light blue +), industrial production (red), personal income excluding transfers in Ch.2012$ (green), manufacturing and trade sales in Ch.2012$ (black), consumption in Ch.2012$ (light blue), and monthly GDP in Ch.2012$ (pink), all log normalized to 2020M02=0. Source: BLS, Federal Reserve, BEA, via FRED, IHS Markit (nee Macroeconomic Advisers) (4/1/2021 release), NBER, and author’s calculations.
Industrial production was whipsawed by weather in February, so it makes sense to look at manufacturing production as well. Seasonally adjusted industrial production rose 1.4% vs. 2.8% for manufacturing production (18.7% vs. 39.1% annualized). Industrial production is 3.4% below levels at NBER peak (2020M02), while manufacturing is 1.7% below. Incidentally, neither has re-attained the local maxima in January 2021.
Atlanta Fed GDPNow (4/15) is for 8.3% in Q1; IHS Markit nowcast (4/15) is 6.0% (both figures SAAR).
Professor Chinn,
Regarding the American Rescue Plan, https://econbrowser.com/archives/2021/03/the-american-rescue-plan
“Peak impact is estimated for 2021Q2, at a 7 percentage point higher level of GDP. This estimate is predicated upon multipliers of a certain size (note interestingly there is little debate over the idea of positive “multipliers”).”
Is the 7% an annualized rate? Seems like it is.
AS: Since it’s the *level* it doesn’t matter if the numbers are annualized. You’re comparing the 2021Q2 level of GDP in bn.Ch.12$ SAAR against a counterfactual 2021Q2 level of GDP in bn.Ch.12$ SAAR. (If it were growth rates in percent, you would be right to wonder.)
Thanks,
I was trying to compute the GDP SAAR for 2021Q2 change from a forecast of 2021Q1. I neglected to increase the forecast of 2021Q1 by the assumed American Rescue Act bump of about 5.5%, so the SAAR change from 2021Q1 to 2021Q2 seemed too large, thus the confusion. After making the change for the 2021Q1 forecast, still having some trouble, since my 2021Q2 SAAR forecast is now only about 3.0%, while the WSJ experts median is about 8.2%. Back to the software.
@ AS
A lot of blog hosts won’t take their own time to answer the questions that gnaw on and vex us “mere mortals”. Menzie is the best.
: )
Let’s keep repeating the term Biden Boom just to tick off the folks at the National Review and Faux News!
Just wondering how much impact the computer chip shortage is projected to have in the overall manufacturing and trade sales projections since the shortages are projected to last into 2022.
• https://www.cnbc.com/2021/04/08/gm-cutting-production-at-several-plants-due-to-chip-shortage.html
• https://www.cnbc.com/2021/04/12/us-semiconductor-policy-looks-to-cut-out-china-secure-supply-chain.html
• https://www.washingtonpost.com/technology/2021/04/13/intel-ceo-semiconductor-chip-shortage/
While there are cost benefits for sourcing to lowest cost suppliers, there are risks as well. Last year demonstrated the problem with foreign sourced pharmaceuticals and PPE in the face of a global pandemic.
• https://www.bloomberg.com/news/articles/2021-02-02/biden-plans-supply-chain-review-after-virus-caused-shortages
Perhaps some of the “infrastructure” spending should be focused on rebuilding some internal sources for critical materials and products. If we can subsidize wind farms and solar arrays, it would seem to be more important to find ways to ensure whole segments of our economy don’t grind to a halt because of supply chain issues.
You’re still babbling about a sector that you have no clue about (semiconductors)? You never replied to the wealth of information I provided. Then again it talked about the economics of this sector I figured it would all go right over your little head. Which is why your source of information are the brain dead heads at CNBC. At least they realized this:
‘Under President Joe Biden, the U.S. is looking to bring manufacturing back to American soil and reduce reliance on a handful of chipmakers.’
A little quiz for you. What US companies are already major players in this sector? You don’t know – do you? Babble on wee with little brains.
“President Joe Biden will order a government-wide review of critical supply chains, in an effort to reduce U.S. reliance on countries such as China for essential medical supplies and minerals, according to people familiar with the matter. The administration’s goal is to protect government and private sector supply chains to prevent future shortages and limit other countries’ ability to exert leverage over the U.S., according to an administration official.”
We should have been doing this four years ago. Susan Rice had a whole plan that included these prudent measures. Of course we know it all got trashed by the complete clown shown known as Team Trump. Which of course Bruce Hall applauded at every turn.
“Then there are the fabless semiconductor firms, which design chips but outsource manufacturing to so-called foundries. The two biggest foundries are TSMC in Taiwan and Samsung Electronics in South Korea.”
Well this is embarassing. Yes TSMC is responsible for 55% of foundry production, which effectively is contract manufacturing. The real value comes from the designs, which TSMC does not do. And while it is true that Samsung has a foundry line of business. But Samsung also designs and produces semiconductors, which is a much larger and more profitable part of its business.
Hey Bruce – there are much better discussions of this sector some of which I linked to. But leave it to a know nothing village idiot like you to rely on the incomplete knowledge of CNBC.
Another CNBC story told me what I already knew:
“Intel announced on Tuesday that it will spend $20 billion to build two major factories in Arizona.”
So Biden is fulfilling all those Trump promises that Team Trump completely dropped the ball on.
Menzie, February manufacturing and trade sales was published yesterday, just 45 minute after industrial production, at down 1.9%…you could have waited..
rjs: I have a feeling of deja vu. (1) that release you are referring to is in nominal terms; (2) it’s pretty clear to me that series is different from the transformed series generated by St. Louis Fed, as I understand constructed to mimic what NBER was looking at (at least in the 2003 business cycle release).
manufacturing and trade sales is about one-third retail, deflated with components of the CPI (up 0.4% in February), one third wholesale, approx two third of which would be deflated with the PPI for finished goods (up 1.4%), and one third factory shipments, which again would be deflated with various components of the PPI, which were up 1.4% and more…so in real terms, we’re looking at February manufacturing and trade sales being down 2.8% or more..
re: deja vu: yes, that does seem to be the second time i looked at that graph without reading your footnote that it showed manufacturing and trade sales in Ch.2012$
it won’t happen again…
Back to counting cranes in Seattle. There are fewer now than there were in 2019, but they are getting put up faster than they are coming down.