Personal income and consumption for May were released last week, as well as the April manufacturing and trade industry sales figure.
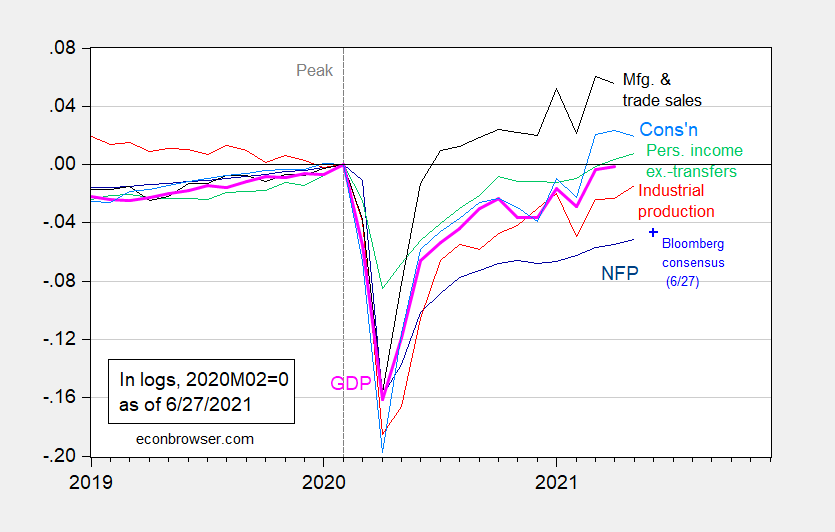
Figure 1: Nonfarm payroll employment from May release (dark blue), Bloomberg consensus as of 6/27 for June nonfarm payroll employment (light blue +), industrial production (red), personal income excluding transfers in Ch.2012$ (green), manufacturing and trade sales in Ch.2012$ (black), consumption in Ch.2012$ (light blue), and monthly GDP in Ch.2012$ (pink), all log normalized to 2020M02=0. Source: BLS, Federal Reserve, BEA, via FRED, IHS Markit (nee Macroeconomic Advisers) (6/1/2021 release), NBER, and author’s calculations.
As suggested by retail sales ex. food (discussed in this post), manufacturing and trade industry sales pulled back, as did consumption, albeit in both cases moderately. Here’s an updated version of the graph from that post.
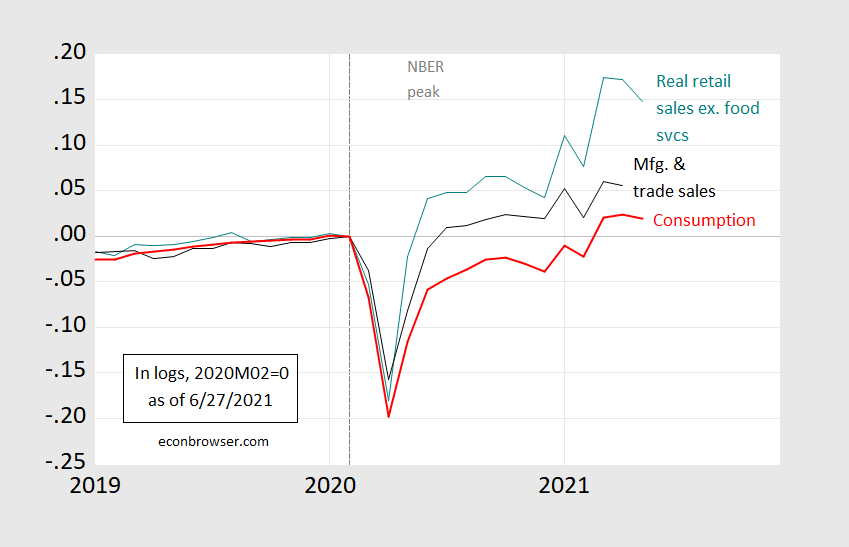
Figure 2: Retail sales excluding food services in 1982-84$ (teal), manufacturing and trade sales in 2012$ (black), and consumption in 2012$ (red), all in logs, 2020M02=0. Retail sales ex-food deflated using CPI-all. Source: Census, BEA, BLS, St. Louis Fed via FRED, and author’s calculations.
The consensus (Bloomberg) is for continued increase in nonfarm payroll employment in the June release (July 2nd), at 675,000. Assuming no revision to the May level, employment will still be 4.7% below peak levels (in log terms).
Nowcasts for Q2: Atlanta GDPNow at 8.3% (6/25), NY Fed at 3.4% (6/25), and IHS-Markit at 8.1% (6/25).
Off-topic, but important reading
Our good man Professor Hamilton has shown an interest in digital currency. I must confess to not being a fan of digital currency (both for my own old-manish “creepy uncle” sentimental reasons, and for what I view to be legit reasons as well~~security, privacy, crime, etc). But in allegiance to one of our two great bequeathers of knowledge on this blog, I pass on the following link:
https://www.ft.com/content/adc2130e-0f46-4da2-ae3f-3b4b0cacbeda
Get familiar with the new terminology CBDCs, as this old man is more than a bit sad to say, I don’t think it’s going away.
Now that a number of states have cancelled the extended and enhanced unemployment checks, it would be interesting to compare job growth in those states with job growth in states that didn’t cut unemployment checks. How many extra workers can they squeeze out of the woodworks. What effects will it ultimately have on their average salaries, consumption and economic growth.
Ivan Instead of looking at job growth, I would look at changes in the growth rate of each state’s labor force that is outside of normal trend growth. States that cut benefits did so under the assumption that enhanced benefits discouraged people from entering the labor force. The July labor force data should tell us whether that theory is right or wrong. If we don’t see any jump in the labor force participation rate, then states sacrificed increased aggregate demand for no benefit in labor force participation.
My own pet theory is that during the pandemic a lot of spouses (frequently women) came to the realization that their pre-pandemic net income (i.e., after accounting for daycare costs, away from home meal costs, etc.) did not justify the aggravation of having to suffer through lousy and unfulfilling jobs. For example, if working multiple low-paying wait staff jobs at staggered hours means you have to buy expensive, fatty take-out meals because you can’t cook at home, then maybe that marginal dollar from working isn’t worth the hassle and exhaustion. I suspect that a lot of families have learned that the small luxuries they used to buy with the extra pre-pandemic income is not worth the cost. Eventually they might revisit that and decide to go back to work, but for the moment they’re fine staying home with the kids and trying out new recipes they saw on the various cooking channels.
This makes perfect sense. It’s probably not just women who are figuring it out, either, although the bulk of people with kids who have made that calculation and left the workforce probably are women. There are others who may have been working under the table and see no reason not to keep doing so. There are also some who opted for an earlier than planned retirement. I know some who did that. We had a much bigger disruption in the workforce than anything I can ever remember. The demographic results are going to be another uncontrolled economic experiment, since the birth rate has not come back since the great recession, so far as I know, and it’s probably even further down now.
Check this out from Kevin Drum:
https://jabberwocking.com/is-missouri-a-jobs-superstar-or-a-jobs-flop/
He notes the NYTimes that ltr provided here. But using another employer in the same state the lying WSJ pitched just the opposite tale. Yes – you are calling for actual evidence. Let’s be careful with the spinmeisters.
https://www.nytimes.com/2021/06/27/business/economy/jobs-workers-unemployment-benefits.html
June 27, 2021
Where Jobless Benefits Were Cut, Jobs Are Still Hard to Fill
Missouri scrapped federal pay to the unemployed, saying it kept people out of the labor market. But so far, workers still seem to be choosy.
By Patricia Cohen
MARYLAND HEIGHTS, Mo. — By lunchtime, the representatives from the recruiting agency Express Employment Professionals decided to pack up and leave the job fair in the St. Louis suburb of Maryland Heights. Hardly anyone had shown up.
“We were hoping we would see prepandemic levels,” said Courtney Boyle, general manager of Express. After all, Missouri had just cut off federal unemployment benefits.
Business owners had complained that the assistance, as Gov. Mike Parson put it, “incentivized people to stay out of the work force.” He made Missouri one of the first four states to halt the federal aid; a total of 26 have said they will do so by next month. But in the St. Louis metropolitan area, where the jobless rate was 4.2 percent in May, those who expected the June 12 termination would unleash a flood of job seekers were disappointed.
Work-force development officials said they had seen virtually no uptick in applicants since the governor’s announcement, which ended a $300 weekly supplement to other benefits. And the online job site Indeed found that in states that have abandoned the federal benefits, clicks on job postings were below the national average.
Of course, it’s early. But conversations with employers who are hunting for workers and people who are hunting for jobs in the St. Louis area revealed stark differences in expectations and assumptions about what a day’s work is worth.
The divide raises a fundamental question of what a healthy labor market looks like. Does it mean workers are on such a knife edge that they feel compelled to take the first job that comes along? Or is it one in which employers are the ones who have to scramble and feel pressured to raise wages and improve working conditions? Are the economy and the public better off when workers get to be choosy or when employers do?
“One way you might define normal is when employers and workers have the same idea of what an appropriate package looks like, and then the issue is matching up the people with the jobs,” said Katharine G. Abraham, an economist at the University of Maryland and a former commissioner at the Bureau of Labor Statistics.
“Clearly part of the problem now,” she said, “is that what employers and what workers think is out of whack.”
Why businesses are having such trouble hiring when 9.3 million people were unemployed in May is a puzzle that has generated lots of speculation, but little hard evidence. Many economists are skeptical that enhanced jobless benefits have played an outsize role in the hiring squeeze. They are more likely to point to child care and continuing health fears with less than half the population fully vaccinated. Nor should it be surprising that the nation’s road back from the harrowing limbo of the pandemic, in which millions of jobs vanished and more than 600,000 people have died, is bumpy….
https://fred.stlouisfed.org/graph/?g=rbMS
January 4, 2020
United States Employment-Population Ratio, * 2020-2021
* Employment age 25-54
https://fred.stlouisfed.org/graph/?g=tKur
January 4, 2020
United States Employment-Population Ratios for Men and Women, * 2020-2021
* Employment age 25-54
https://fred.stlouisfed.org/graph/?g=tQiS
January 4, 2020
Employment-Population Ratios, * 2020-2021
* Bachelor’s Degree and Higher, Some College or Associate Degree, High
School Graduates, No College; Employment age 25 and over
https://fred.stlouisfed.org/graph/?g=x6ix
January 4, 2020
Employment-Population Ratios for White, Black and Hispanic, * 2020-2021
* Employment age 16 and over
ltr: “Where Jobless Benefits Were Cut, Jobs Are Still Hard to Fill” from the New York Times
Ha. The Wall Street Journal runs a similar story about Missouri, but with a twist. They say that employment benefits in Missouri have been cut off which proves this is successful because — wait for it — fewer people are collecting benefits. That’s science!
In other news today, the WSJ discovers that when it stops raining, people are less wet.
I provided a link to the Kevin Drum compare and contrast. I wonder what 2slug’s take would be in light of his interesting comment here.
The rate at which the Missouri labor force is growing seems to have flattened out in May. That’s strange because most workers knew in May that benefits in Missouri would be cut in June, so if the “get your lazy ass off the couch” theory were right, that should have led to a jump in the labor force, although not necessarily in the number of people who are employed. But that’s not what happened. The BLS data shows a significant flattening of the labor force in May after several months of steady increases. Maybe the June numbers will be different, but that assumes Missouri workers are extremely myopic.
When you look at the BEA’s state GDP data for Missouri it looks like the state has more or less recovered to its pre-pandemic level. There are really only two sectors where that’s not the case: Accommodations & Food Services and Arts, Entertainment & Recreation. Those two sectors are far below their pre-pandemic level. But what’s especially interesting is that the average weekly earnings in the Leisure and Hospitality sector spiked sharply in March and have continued to rise. The BLS doesn’t provide average weekly hours for that sector so we don’t know if businesses just started paying more or if they just started working people to death. I suspect the latter since average hourly earnings in that sector rose steadily but did not spike.
Here’s a little anecdotal observation I’ve seen around my neck of the woods. In normal times you’d see a lot of teenagers looking for summer jobs; but this year those teenagers seem to be sitting things out. Instead of getting regular burger flipping jobs they’re knocking on the door looking to mow my lawn. The kind of work where you set your own hours and don’t have a boss. Can’t remember the last time teenagers were looking for lawn mowing jobs. Anyway, I’m wondering if a lot of those teens feel like they missed out on having a fun summer last year because of the pandemic and they’ve decided to try and recover that lost year now. That makes a regular burger flipping job a lot less attractive. I can’t say as how I would blame them. You’re only 16 once.
The widespread expectation tha growth will continue strog in the current quarter seems reasonable. The big risk seems to come late in late Q3 and into Q4. Under current law, all enhanced federal jobless benefits will expire in September, as will the moratorium on student loan payments. The eviction moratorium is set to expire in a month, I think. And schools will reopen with the Delta variant ripping through under-vaccinated states. Could be a formula for a weak Q4.
My prediction that “WTI” will not hit $100 and gasoline at the station will NOT hit $4 per gallon on a national average was excluding Delta’s effects. Then add in that to states with less than 50% vaccination rates?? I’m not losing any sleep “sticking my neck out” on that little prediction. Which really was going into June of 2022. I will admit failure on this if we hit say $100 for a solid week before June 31, 2022. I will admit I was wrong then. As I said, not worried about it.