From Bloomberg today, “The Great Reflation Trade Is Buckling All Across Wall Street”:
The reflation trade that hammered bonds, drove stock gauges to repeated records and re-energized long dormant value shares this year is in rapid retreat.
Driving the drama is the bond market. Benchmark 10-year Treasury yields broke below 1.3% Wednesday as real rates — which strip out the effect of inflation — sank below minus 1%, signaling that traders are souring on the growth outlook.
Here’s the picture at the 5 year horizon, using the standard inflation breakeven calculation (5 year Treasury’s minus 5 year TIPS), and the DKW adjusted inflation expectations.
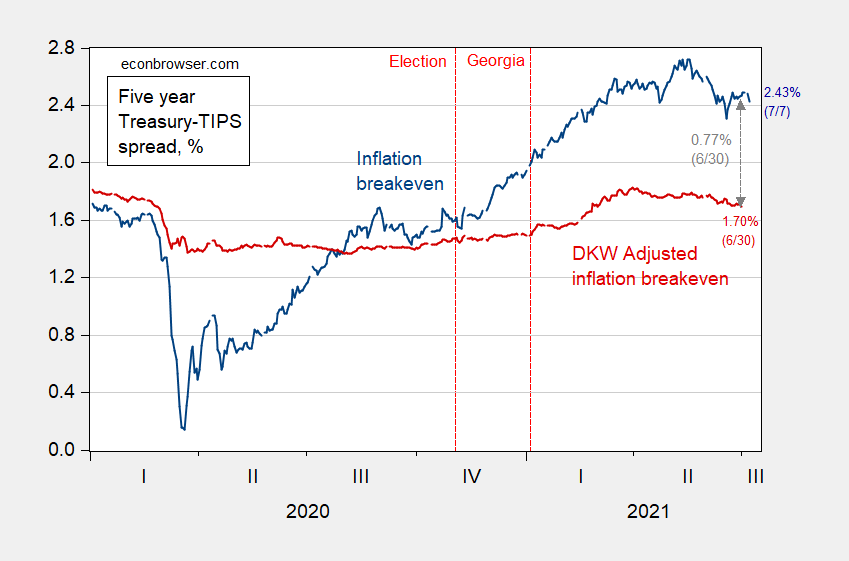
Figure 1: Five year inflation breakeven calculated as five year Treasury yield minus five year TIPS yield (blue), five year breakeven adjusted by inflation risk premium and liquidity premium per DKW, all in %. Source: Fed via FRED, Treasury, KWW following D’amico, Kim and Wei (DKW) accessed 7/7, and author’s calculations [graph updated 7/7 to include 7/7 observation for unadjusted breakeven].
While the conventionally calculated breakeven hit a peak on 5/18 at 2.72% (market close), the peak according to the DKW adjusted series was 1.81% on 3/29. As of 6/30, the gap between the two series 0.77%.
As Joseph E. Gagnon and Madi Sarsenbayev point out, neither bond markets nor economists does very well at prediction (although the DKW series doesn’t seem to do so badly in a quick and dirty comparison).
In any case, the market in all its wisdom (or lack thereof) seems to be seeing less inflation than previously anticipated, going forward.
Did the author of this Bloomberg piece intend confuse his readers or what? First of all he complains that interest rates (nominal) are rising but interest rates (real) are negative. And after he notes the economy is growing but not at double digit rates, he writes:
“Fading demand has battered small caps, once the favored reopening play as U.S. vaccination rates climbed. ”
Fading demand simply because we do not have 10% per annum growth rates. Bloomberg needs better writers.
Fading demand has battered small caps, once the favored reopening play as U.S. vaccination rates climbed.
I’m confused. That’s normal, but even so, there’s a lot of contradictions going on there.
JOB OPENINGS AND LABOR TURNOVER – MAY 2021
https://www.bls.gov/news.release/jolts.nr0.htm
The number of job openings was little changed at 9.2 million on the last business day of May, the U.S.
Bureau of Labor Statistics reported today. Hires were little changed at 5.9 million. Total separations
decreased to 5.3 million. Within separations, the quits rate decreased to 2.5 percent.
You have to wonder just a bit about the DKW method of extracting what they call “expected inflation” from the breakeven rate. The “expected inflation” rate cannot be directly observed. It can only be inferred. In this case DKW are using the Black – Scholes method employing Brownian motion and drift.
The difference, subtracting the DKW “expected inflation” from the breakeven rate is shown by the double arrow in the graph above, 0.77%. This difference represents the inflation risk premium or the expectation of “unexpected inflation.”
It becomes an almost metaphysical question as to the distinction between “expected inflation” and the expectation of “unexpected inflation.” DKW can draw a line using their method, but I’m not so sure that line shouldn’t be a lot more fuzzy.
When I was studying for an MBA, there was a lot of discussion about discount rates. I thought picking a discount rate was random voodoo and still do. A range would have been a better idea. Trying to calculate a specific “expected inflation” rate is about the same. For what it’s worth, an MBA is as close to actual economics as I ever got, beyond a college class I took pass/fail and deliberately failed the final because my grade was too high to possibly fail the class going into the final.
If the method for calculating the discount rate is not consistent with the Arbitrage Pricing Theorem (APT) then it is junk science. Now APT simply holds that the discount rate is the sum of the risk-free rate and the premium for bearing systematic risk. Of course there are so many ways people estimate the latter – many of which should be considered junk science.
Of course there are way too many consultants like Princeton Steve whose approach is to ask the paying client – what do you want the discount rate to be and then work backwards to justify that rate.
Comes down to prices. Expected inflation has an implicit price. Uncertainty about expected inflation also has an implicit price. Conventionally, point estimates are used to express such implicit prices. Point estimates don’t reflect confidence.
https://static.nytimes.com/email-content/PK_sample.html
July 6, 2021
Eternal voodoo: They just can’t quit tax cuts
By Paul Krugman
Don’t make a big deal out of one month’s employment numbers! That’s been a cardinal rule of short-term economic analysis and good economic journalism as long as I’ve been in the business. Month-to-month numbers are noisy in the best of times. They’re especially noisy now, as documented in a recent blog post from Joe Biden’s Council of Economic Advisers: The pandemic and its aftermath have thrown things like normal seasonal patterns out of whack, so what looks like a big number, good or bad, may well just be random measurement error.
The council has been urging us to focus on three-month averages, which is a reasonable if imperfect fix. As of a month ago the three-month average showed employment growing at an annual rate of 4.54 percent; the latest report raised that to 4.7 percent. Both are very good numbers; leaving aside the wild pandemic-related swings of 2020, we haven’t seen this kind of growth since 1984. But your assessment of how we’re doing shouldn’t have changed much.
What actually happened, of course, was a huge change in the tone of media economic coverage — and an even huger change in the tone from Republicans. Before Friday’s report, they were all denouncing Biden for presiding over a weak economy. As soon as the new number came out, they swung 180 degrees and began touting the economy’s extraordinary success, which they said was a dramatic vindication of … Donald Trump’s 2017 tax cut.
This wasn’t the first time we’ve seen this story — or the second, or the third, or …. In fact, it’s behavior that goes back to the Clinton years. When Bill Clinton raised taxes in 1993, Republicans en masse declared that a depression was imminent. When the economy boomed instead, they insisted that credit for the good economy of the late 1990s be given to Ronald Reagan’s 1981 tax cut. Applying the same time lag to Reagan-era developments would imply giving credit for the 1983-84 boom to Lyndon Johnson, but somehow that wasn’t part of the argument.
Now, it’s not news that there is, in fact, not a shred of evidence in favor of claims that tax cuts have magical effects. Here, for example, is a picture of taxes and job growth over the decade before Covid-19 hit:
https://static01.nyt.com/images/2021/07/06/opinion/krugman060721_1/krugman060721_1-articleLarge.png
See the impact of taxes? Me neither.
The actual tax changes were bigger than the picture shows: Barack Obama also introduced new taxes to pay for the Affordable Care Act, and Trump’s tax cut was largely focused on corporate profits. But you see that there were two big changes in tax policy. Do you also see the big economic downshift after Obama raised taxes and the big upshift after Trump cut them? Neither do I….
https://fred.stlouisfed.org/graph/?g=Ff2z
January 30, 2018
Individual Income Tax Rate at highest bracket and Nonfarm Employment, 2010-2021
“When Bill Clinton raised taxes in 1993, Republicans en masse declared that a depression was imminent. When the economy boomed instead, they insisted that credit for the good economy of the late 1990s be given to Ronald Reagan’s 1981 tax cut. Applying the same time lag to Reagan-era developments would imply giving credit for the 1983-84 boom to Lyndon Johnson”
Now that’s funny!