Dean Baker has an interesting article conjecturing about future declines in the CPI, being driven by gasoline, cars, and food. The argument seems plausible, depending on what happens in the supply chains and the oil markets. I want to consider what might happen, depending on other components.
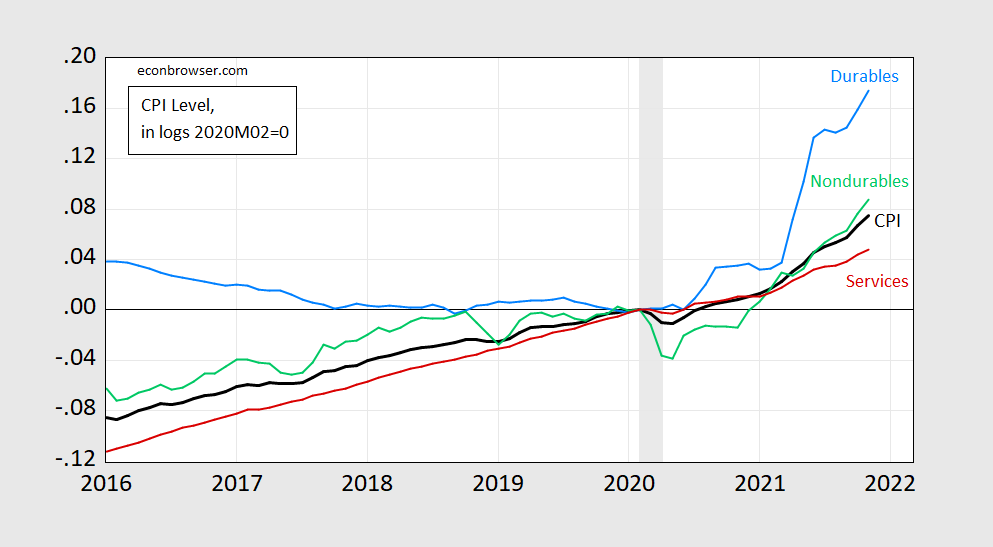
First, consider what has driven overall inflation is in large part the surge in durable goods prices.
Figure 1: CPI-all urban (bold black), CPI-durables (light blue), CPI-nondurables (light green), and CPI-services (red), all in logs, 2020M02=0. NBER defined recession dates peak-to-trough shaded gray. Source: BLS (November 2021 release) via FRED, NBER, and author’s calculations.
Should public health concerns diminish, then as consumption switches back to services, durable goods prices might stabilize and even come down. Remember, supply chain problems involving getting goods from where they’re produced to where they’re demanded are driven in large part by the surge in demand for goods — as opposed to diminished supply capacity at ports, etc. This is a variation on Baker’s argument, and others.
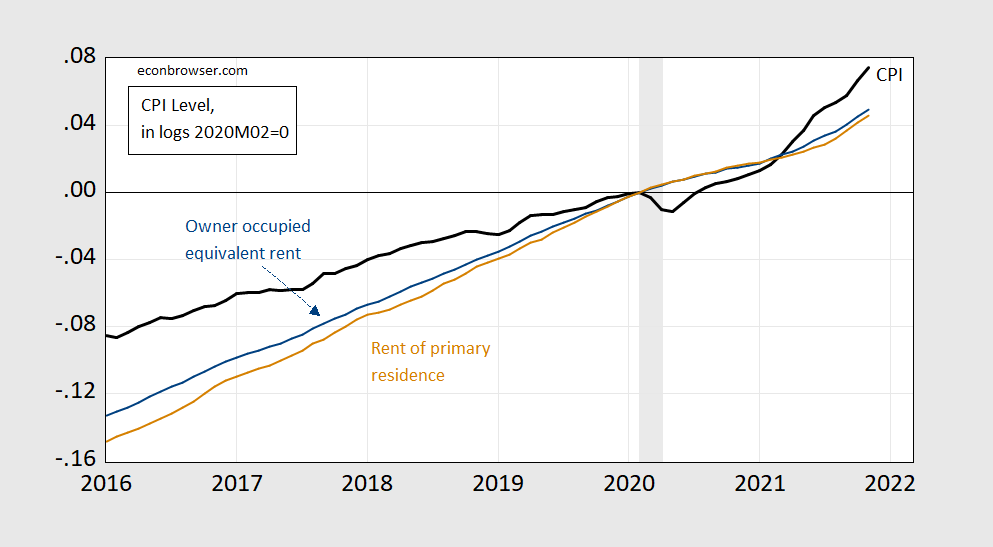
Another area of concern revolves around housing costs, which are unambiguously rising:
Figure 2: CPI-all urban (bold black), CPI-owner occupied equivalent rent (blue), and CPI-rent of primary residence (tan), all in logs, 2020M02=0. NBER defined recession dates peak-to-trough shaded gray. Source: BLS (November 2021 release) via FRED, NBER, and author’s calculations.
Rent of primary residence accounts for 7.6% of total weight in October 2021, and owner equivalent rent of residences, 23.5% (see Table 6 in the release). Growth in the former accounted for 1.3 percentage points of the 9.8% m/m CPI inflation rate in November, while growth in rent accounted for 0.4 percentage point.
A reader notes that the accelerated rise in owner occupied equivalent rent is likely to persist.
Average lag time from house price index to cpi owners equivalent rent is 18 months.
YoY inflation is forecast to remain, and likely to even increase, in 2022
The CPI measure of rents is also measured in a way that lags commonly observed rent measures.
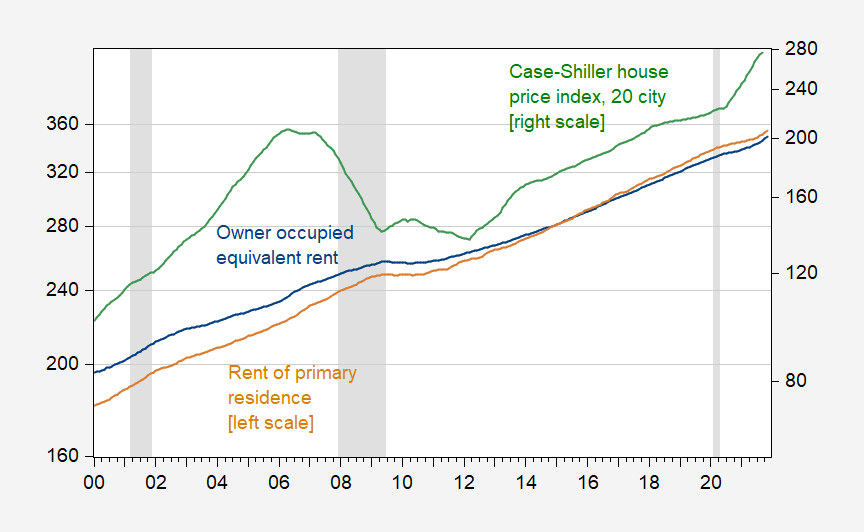
Here is a picture of owner occupied equivalent rent (and rent) versus house prices.
Figure 3: CPI-owner occupied equivalent rent (blue, left log scale), and CPI-rent of primary residence (tan, left log scale), Case-Shiller 20-city house price index (green, right log scale). NBER defined recession dates peak-to-trough shaded gray. Source: BLS (November 2021 release) via FRED, S&P via FRED, NBER, and author’s calculations.
A visual inspection seems to uncover a relationship, particularly in y/y changes (but not in long-run cointegration). At 18 months (using non-overlapping changes), the relationship is 0.08 – that is a one percentage point increase in the y/y growth rate leads to a 0.08 percentage point increase in the OER component growth rate. Taken literally, the September reading of 17.5% y/y change (log terms) implies that in March 2023, OER inflation will be 1.4 percentage points higher as a consequence. Since I have little faith in the regression (given some of the diagnostics), I’m not going to bet on this number.


Moses linked to a very good article in comments to the prior post, covering some of the same points as Baker does. For those who missed it:
https://www.bis.org/speeches/sp211209.pdf
Thanks for this must read discussion. Three things caught my eye. The discussion on the semiconductor market was quite nice. Can we demand Bruce Hall read it as it undermines just about everything he has said on this sector?
Then we have this good news:
‘The case of shipping freight could be considered a more straightforward example of strong
demand interacting with constrained supply, especially for trade between Asia and the United
States. But here too prices have exhibited large fluctuations (Graph 1, right-hand panel). Shipping
costs for bulk commodities rose sharply, only to retrace much of the gains later (blue line). More
recently, container shipping prices have also started to decline (red line).’
So much for JohnH’s little theory that some evil shipping cartel has finally decided to permanently increase their markups.
The discussion on durable goods pricing dovetails what Dean wrote as what you host has written. Which undermines JohnH’s pet oligopoly and inflation hypothesis! Of course, it would help if we told Whirlpool they have to compete with Samsung as we are saying no to Trumpian tariffs on washing machines!
pgl may think that a shipping cartel does not exist…or that companies don’t collude. But their bad behavior seems to have gotten so egregious that Congress looks poised to act. https://prospect.org/economy/inflation-fighting-bill-you-dont-know-about/
Isn’t it curious how a self-anointed progressive growth liberal regularly defends cartels and oligopolies by denying their existence and how their price gouging contributes to inflation? Even Republicans can see what pgl is willfully blind to!
It is a bald faced LIE that I support cartels. But hey – lying is your only forte. My only comment was that shipping costs fell after the 2008 boom and may be coming down from the recent spike. But hey – if there is a cartel, they should go after it. But do think about this head line:
“An overwhelmingly bipartisan effort would finally crack down on the ocean shipping cartel.”
There was this nut case named JohnH who kept telling us members of Congress were in bed with this sector and would never do anything like this. Can you call this nutcase and tell him to stop abusing your name?
“As a result, the top ten ocean carriers today control twice as much of the market, more than 80 percent, as they did in 1998. They are divvied up into three dominant carrier alliances, giving exporters even fewer choices. None of the major carriers are U.S.-based.”
Gee we have finally seen something on market concentration from a JohnH link. A little progress I guess but does he get why these carriers are not based in the US? Could it be that they are all formally based in tax havens so whatever profits they make go tax free? Now I have written on this extensively but of course dim witted JohnH was not aware of this either.
Now – let’s see if our village idiot can learn to read the Annual Reports of some of the big players and get back to us with an analysis of their returns to capital over the 1998 to 2020 time period. Snicker!
I dug up the financials for the largest publicly traded shipping company because we we all know JohnH is incapable of such basic research:
https://investor.maersk.com/financial-reports
Maersk Shipping owns about $28 billion in ships. In 2019, its operating profits were a mere $1.7 billion. If JohnH thinks this is some sort of obscene level of oligopoly profits – no wonder his Fortune 200 company went bankrupt.
Yea – profits were higher in 2020. Like I have said – shipping profits are volatile. And for this – our lying village idiot accuses me of being a supporter of cartels.
I get others here have accused this troll of being anti-data. You folks are quite right.
Hey, pgl, glad to know I still reside in your brain.
Regardless of the speculation by the BLS, automotive manufacturers have learned their lesson from this JIT/supply chain debacle. Most evident is the planning to build locally sourced dedicated battery plants. Regardless of the “economies” of sourcing in longer supply chains (geographically), there are growing geopolitical uncertainties that are driving this change. The same thing is happening with semiconductors.
Once bitten; twice shy.
“automotive manufacturers have learned their lesson from this JIT/supply chain debacle.”
Thanks for letting us know that they have finally realized your advice is STOOPID.
Wage/Price spirals don’t happen anymore. Instead businesses eat the loss and survive on debt until the market loses confidence. This is why no inflation popped in the late 90’s even when the economy was running at “full employment”. It eventually destroyed balance sheets by 1999 killing real profits and real earnings. Confidence then went in 2000. The late 2010’s saw somewhat of the same effect though in that case, companies were pairing investment to keep balance sheets declining too much where confidence would be lost. The paradox where that was heading, was that investment would have to be cut so low, the economy loses steam, confidence is lost, markets crash in 2020. In 2021 debt crisis emerges as corporate and subprime consumer debt causes bankruptcies. Most of the wage growth in 2021 is the economy snapping back like the 2020 excessive lockdowns never happened. Indeed, inflation and wage growth will slow in 2022.
This paper is living in a fantasy world. We live in the debt era now. One based on ponzi confidence schemes. Unlike free market intellectuals, I believe its caused by structural growth declining as its has been since 1974 and then again accelerating in 2001. The system can’t grow fast enough anymore without dollar inflows from foreign elitist sources(which is a large reason for the “migration crisis”). Americans and frankly the “west” in general need to take a large pay cut and accept 1-1.5% growth as max potential. The party is over and has been for sometime for Capitalism.
Let’s Dean credit for providing his detailed assumptions. I wonder if Mitch McConnell will eat his hat if CPI falls by 0.5% over the next 12 months. Of course one could quibble with some of Dean’s detailed assumptions but I found one thing of interest. Alcoholic beverage price inflation has been a mere 1.9% over the past 12 months and Dean forecasts this rate to continue.
Now your conjectures would have us paying more for the house but at least we will pay less for those appliances!
I wonder how much of the “mythical” eviction crisis was a property owner created lie to try and grab at the cash???? I would say quite a bit. Sad to see some political goofs fall for it.
Dean notes:
“Tobacco prices are driven largely by state and local taxes on tobacco. In the last year, they rose by 8.9 percent. This is considerably more rapid than the 3.9 percent average increase over the prior decade. I am assuming that the rate of increase slows to its prior average.”
There is that $1.01 per pack Federal excise tax on cigarettes which was increased from a much lower level under Obama. In my view, we should tax tobacco even more.
It seems there was a proposal included in BBB to double the Federal excise tax on cigarettes, which was estimated to increase tax revenues by about $10 billion a year:
https://tobaccobusiness.com/higher-federal-taxes-on-tobacco-products-a-possibility/
This in my view was a great idea. Of course – it got sacrificed in all the sausage to get two conservative Democratic Senators to get on board. Sad.