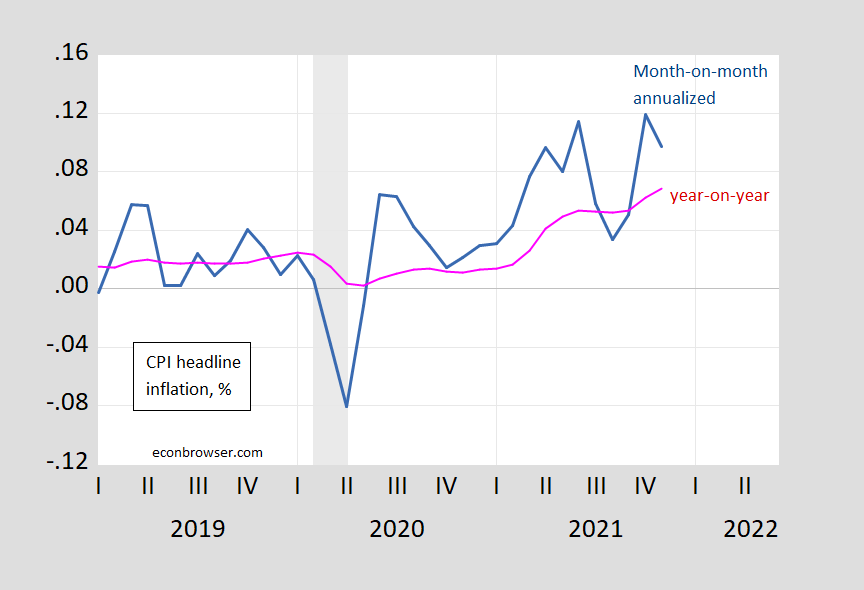
Month-on-month down, even if up year-on-year. Trimmed and sticky price inflation (m/m) are also down.
First, recall 12 month inflation rates (aka y/y rates) are largely backward looking. Month-on-month measures are more reflective of current conditions, albeit more noisy.
Figure 1: CPI month-on-month inflation rate, annualized (blue), 12 month or year-on-year inflation rate (pink), in decimal form (i.e., 0.05 means 5%). NBER defined peak-to-trough recession dates shaded gray. Source: BLS, NBER, and author’s calculations.
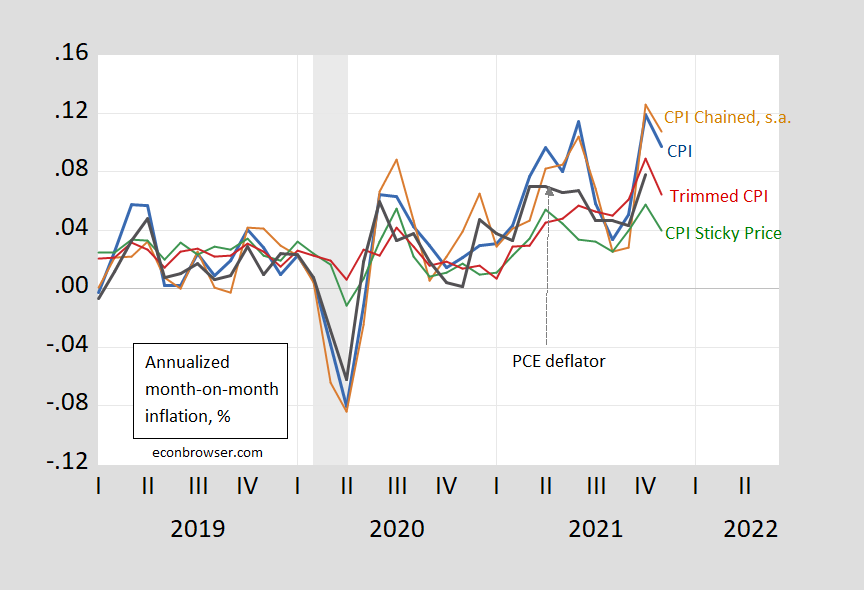
What do other measures of overall CPI inflation look like on a m/m basis?
Figure 2: Month-on-month inflation of CPI (blue), chained CPI (brown), 16% trimmed CPI inflation (red), sticky price CPI inflation (green), personal consumption expenditure deflator inflation (black), all in decimal form (i.e., 0.05 means 5%). Chained CPI seasonally adjusted using arithmetic deviations (brown). NBER defined recession dates (peak-to-trough) shaded gray. Source: BLS, BEA, Atlanta Fed, NBER, and author’s calculations.
Figure 2: CPI – all urban (blue), , in decimal form (i.e., 0.05 means 5%). NBER defined peak-to-trough recession dates shaded gray. Source: BLS, NBER, and author’s calculations.
Chained CPI m/m inflation is down, as are trimmed mean and sticky price. A lower trimmed mean inflation means that the decline in broad-based, and not being driven by outliers. Declining sticky price inflation means that infrequently changed prices are rising, but at a slower pace than before.
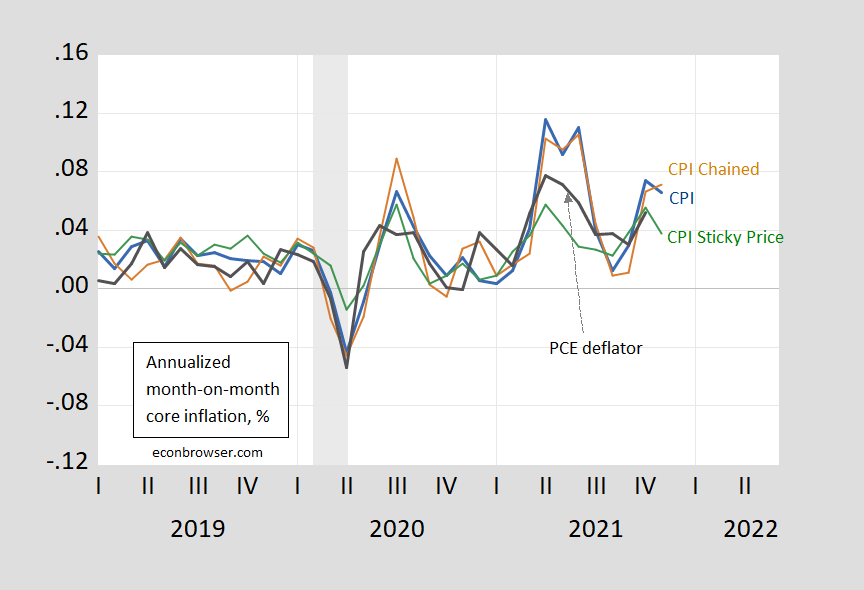
Moving to core measures (i.e., excluding food and energy prices), we see the following picture (note the vertical scale is made to have the same range as in Figure 2 to better illustrate how core measures have exhibited less variability).
Figure 3: Month-on-month CPI core inflation (blue), chained CPI core (brown), sticky price CPI core inflation (green), personal consumption expenditure core deflator inflation (black), all in decimal form (i.e., 0.05 means 5%). Chained CPI seasonally adjusted using arithmetic deviations (brown). NBER defined recession dates (peak-to-trough) shaded gray. Source: BLS, BEA, Atlanta Fed, NBER, and author’s calculations.
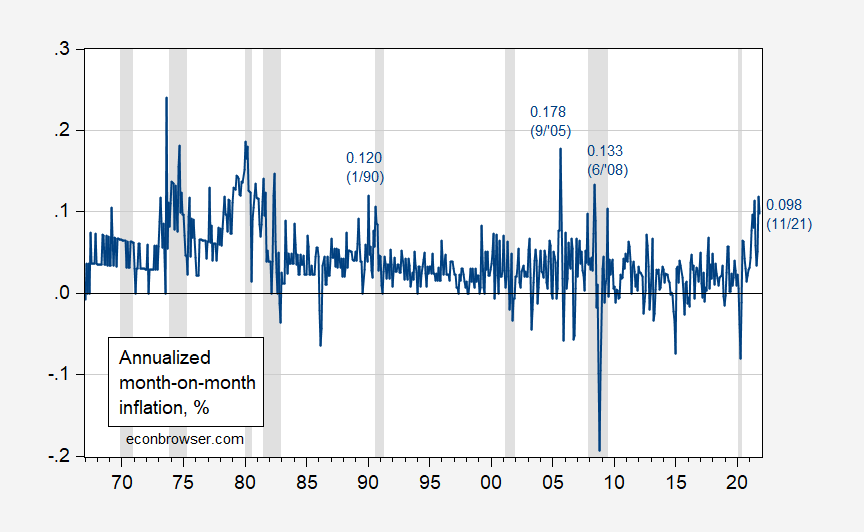
Beware of “records”. On a month-on-month basis, inflation has been higher over the past 20 years.
Figure 4: CPI month-on-month inflation rate, annualized (blue), in decimal form (i.e., 0.05 means 5%). NBER defined peak-to-trough recession dates shaded gray. Source: BLS, NBER, and author’s calculations.
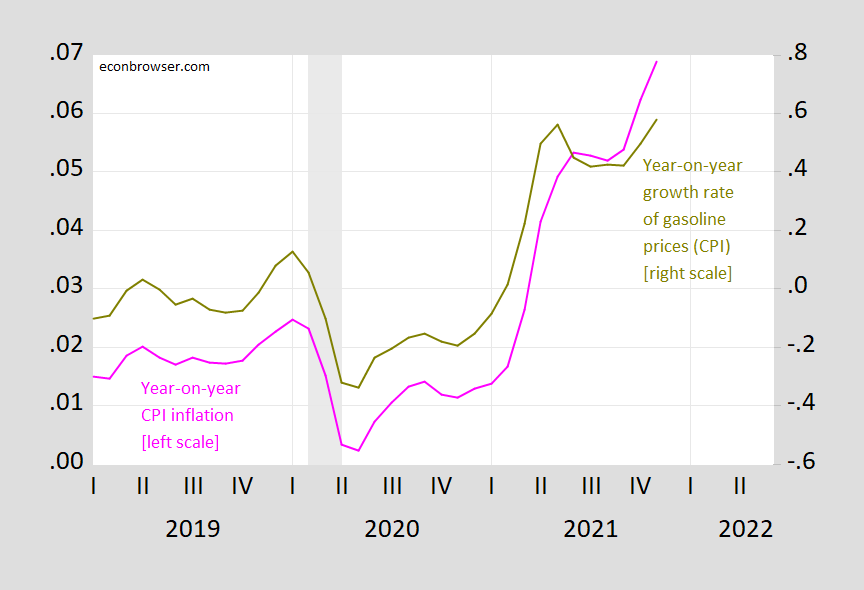
A final observation: whether high inflation m/m persists depends in part on what happens to gasoline prices, as illustrated in Figure 5.
Figure 5: CPI year-on-year inflation rate (pink, left scale), CPI-gasoline component year-on-year inflation rate (chartreuse, right scale), in decimal form (i.e., 0.05 means 5%). NBER defined peak-to-trough recession dates shaded gray. Source: BLS, NBER, and author’s calculations.
Fortunately, oil futures are pointing downward, so indications are for relief on that end.
Caveat, caveat (noisy time series, snapshot datum):
Rigs up for the week. +4 oil, +3 gas.
https://rigcount.bakerhughes.com/na-rig-count/
So naturally, the press led with the y/y increase. Can’t have the public getting the impression that the future could be better.
He lost CNN.
He’s in big trouble.
Of late this inflation rate is getting almost as volatile as oil prices!
On a lighter note, each holiday season my Tennessee brother from another mother sends me home-made cashew brittle. It is addictive.
True, I have oil down MoM 18%. Report inflation read is down MoM 11%.
I refuse to make the cashew brittle for myself. I would weigh 400 lbs.
Gasoline prices have been falling since Oct 11 and will continue falling as the Thanksgiving – New Years driving ends and Biden’s 50 million barrel release from the SPR hits the market. The price of a gallon of regular is up a nickel from a decade ago although it’s up 55% y/y. https://fred.stlouisfed.org/series/GASREGW#0
The problem is that people are driving trucks and SUVs now instead of more fuel efficient cars so their overall cost for fuel is higher than the Obama years.
The problem is that people are driving trucks and SUVs now instead of more fuel-efficient cars so their overall cost for fuel is higher than the Obama years
Pardon, the move towards lower efficiency truck chassis vehicles has been an ongoing development since the 1980s. For all the noise about gas prices, the market tells us that while Americans love to complain about the cost of gas – a national pastime – the reality is that it rarely is a factor in what they buy and drive. And empirically, the cost of gas is a minor household expense; save for the working poor in regions where there is no decent public transit.
Then, culurally we are big on impressions, feelings, not on data, facts.
@Paul Mathis,
I agree, though light trucks and SUVs are much more fuel efficient now than they were several decades ago.
The real problem might be American policy ‘exceptionalism’. Of all the rich western nations, the USA charges the lowest excise/green/Pigouvian/carbon taxes on gasoline and diesel.
That policy contributes to low-density suburbs in ecologically dangerous areas and extremely bad health outcomes: almost 45% adult obesity rate, trending to 50%, high rates of COPD, etc.
Interesting story:
https://www.npr.org/2021/12/10/1063112624/redditors-spam-kelloggs-job-portal-striking-workers-union
Denial of service attack, one application at a time.
I don’t have to tell you i relish that story do i.
When it’s thousands of cereal eaters I”d love to see Kellogg’s try to prosecute that one. They’ll play hell getting me to buy ANY Kelloggs until I hear happy chirping from the union.
The net profit margin in the food processing sector in 2019 was 5.16%. Kellogg’s margin was higher than that in every quarter of 2019 and has risen steadily since, to 8.86% in Q3. Still higher than the sector as a whole. So we aren’t looking at a struggle to remain profitable. Kellogg is taking away jobs to remain excessively profitable.
How are you defining net profit margin? I presume you deducted interest expenses and income taxes but …I just went to sec.gov to look at the latest 10-K for this company. Over the 3-year period ended 12/31/2021, sales averaged $13.63 billion with cost of goods = 66.2% of sales and operating expenses = 21.9%. So its operating profits (EBIT) have been near 11.9% of sales even before the most recent quarters. Yea – Kellogg does rake in a fat operating margin.
8.48% is the profit margin number for the 3rd quarter, so I would assume Macroduck is closer to reality if we are going by GAAP standards. I don’t know if operating margin is really a good number to go by. I think profit margin would be a better barometer.
That Ebitda number and such has always struck me as Wall Street salesmanship. Like “No need to look at the VIN number history or the blue book value, just look the MSRP”.
I’m trying to figure out what Moses is saying here. Profit margin can mean many different things. My 11.9% figure was the operating margin as in Earnings Before Interest and Taxes (not EBITDA as EBIT deducts depreciation and amortization).
Like I said, you may have deducted income taxes and interest payments. Of course Modigliani and Miller would tell us whether the operating profits are financed by debt v. equity does not matter for the valuation of the operating assets. So why would financing choices impact pricing of goods?
And whether a firm can use clever tax tricks to alter its income tax bite – why would that matter to the pricing of goods.
Mind you I never got a CPA but that has never stopped me from telling accountants that they are utter idiots when it comes to basic economics.
I am so proud of the workers who rejected an offer that would give current workers a decent salary and benefits, but screw everybody who got hired from now on. Don’t send me X-mas presents this year, donate to Kellogg’s union.
Off topic – China’s real estate developer problem
https://www.wsj.com/articles/china-reopens-a-funding-spigot-for-property-developers-11639045808
China has flip-flopped on reeling in developer borrowing. Receivables owed by developers to their suppliers are once again being bought up by factors at a discount. This is essentially a way of forcing suppliers to absorb losses in the place of developers. Better than forcing (more) losses on households, I guess.
These receivables sales are only allowed for rolling over existing, says the WSJ, but that’s built in to this kind of factorng. These are haircuts, not loans.
Menzie, please consider a historical regression between house prices and owners equivalent rent. I think you will find that the former leads the latter usually by about 1 year, intermediate via increases in rent of primary residence. Both forms of rent have been increasing since this spring. If we project that trend forward one year, it very much looks like high headline inflation will persist and may well worsen.
Best regards, NDD
Off-topic
This is worth keeping a peripheral eye on:
https://www.politico.com/news/2021/12/10/jan-6-committee-issues-six-new-subpoenas-524095
https://news.cgtn.com/news/2021-12-11/China-fully-vaccinated-82-5-of-people-close-to-herd-immunity-15UfETYfH5S/index.html
December 11, 2021
China fully vaccinated 82.5% of people, close to herd immunity
Over 1.16 billion Chinese people, or 82.5 percent of the country’s total population, have been fully vaccinated against COVID-19 as of Friday, said an official of the National Health Commission (NHC) at a press briefing on Saturday….
https://www.worldometers.info/coronavirus/
December 11, 2021
Coronavirus
United Kingdom
Cases ( 10,771,444)
Deaths ( 146,387)
Deaths per million ( 2,140)
China
Cases ( 99,604)
Deaths ( 4,636)
Deaths per million ( 3)
Any thoughts on Zhonggua’s 0.2% GDP and power outages??
Is this kinda like the happy days of Mao when millions of people were starving to death, but as my ex-girlfriend’s Mom told me, “everyone felt like they were working together”. Don’t worry, I wasn’t stupid enough to EVER broach the starvations topic with her family, I was having enough problem with the Maotai wine gift to her father and the suck-up routine as it was.
Nowhere near herd immunity. China’s vaccines are not effective enough to confer herd immunity.
The problem with Chinese vaccines had been discussed here, with links to documentation. Your refusal to acknowledge that problem is dishonest.
https://news.cgtn.com/news/2021-12-11/Chinese-mainland-records-87-confirmed-COVID-19-cases-15TKuS9C8QE/index.html
December 11, 2021
Chinese mainland reports 87 new COVID-19 cases
The Chinese mainland recorded 87 confirmed COVID-19 cases on Friday, with 51 linked to local transmissions and 36 from overseas, data from the National Health Commission showed on Saturday.
A total of 30 new asymptomatic cases were also recorded, and 489 asymptomatic patients remain under medical observation.
Confirmed cases on the Chinese mainland now total 99,604, with the death toll unchanged since January at 4,636.
Chinese mainland new locally transmitted cases
https://news.cgtn.com/news/2021-12-11/Chinese-mainland-records-87-confirmed-COVID-19-cases-15TKuS9C8QE/img/2e54b4974f6442cca9753e534a539920/2e54b4974f6442cca9753e534a539920.jpeg
Chinese mainland new imported cases
https://news.cgtn.com/news/2021-12-11/Chinese-mainland-records-87-confirmed-COVID-19-cases-15TKuS9C8QE/img/f617193570f441dc8c2f3babaa04e338/f617193570f441dc8c2f3babaa04e338.jpeg
Chinese mainland new asymptomatic cases
https://news.cgtn.com/news/2021-12-11/Chinese-mainland-records-87-confirmed-COVID-19-cases-15TKuS9C8QE/img/51837f148bfd4d19a48746ce2ee8826f/51837f148bfd4d19a48746ce2ee8826f.jpeg
https://fred.stlouisfed.org/graph/?g=x1E2
January 30, 2018
Case-Shiller Composite 20-City Home Price Index / Owners’ Equivalent Rent of residences, 2017-2021
(Indexed to 2017)
https://fred.stlouisfed.org/graph/?g=oCkD
January 30, 2018
Case-Shiller Composite 20-City Home Price Index / Owners’ Equivalent Rent of residences, 2000-2021
(Indexed to 2000)
https://fred.stlouisfed.org/graph/fredgraph.png?g=JLlD
All data measured YoY
Average lag time from house price index to cpi owners equivalent rent is 18 months.
YoY inflation is forecast to remain, and likely to even increase, in 2022
https://fred.stlouisfed.org/graph/?g=Fn2j
January 15, 2018
Consumer Price Index Rent and Owners’ Equivalent Rent, 2017-2021
(Percent change)
https://fred.stlouisfed.org/graph/?g=w3Wk
January 15, 2018
Sticky Consumer Price Index and Sticky Consumer Price Index less Shelter, 2017-2021
(Percent change)
George Santayana, “Those who cannot remember the past are condemned to repeat it.”
How long have oil futures been pointing downward, because you can make money buying futures low and selling them high, as they rise to spot?
Why not include the wide error margins on CPI? Because your story would disappear in the noise?
rsm: See BLS documentation here. Would you like to revise and extend your comments, given m/m CPI inflation was 0.78%? Sometimes I think you are either (1) unable to use a search engine, or (2) unable to read.
Don’t exclude “both of the above”.
Normally I’m against pile ons, but sometimes it’s just fun to watch the one tag team wrestler throw the opponent straight into his partner’s clothesline.
For the record, Summers was indeed doing his victory lap on the bad rip-off of the old Rukeyser show, saying “Everyone and the Fed now recognizes this isn’t transitive inflation” What is Summers going to say if the seaside docks and shippers finally get their sh*t together before the end of Q1 ’22 and we finally find out most of this was because of supply chains getting effed up?? I realize many, including possibly Menzie, find that far-fetched, but I find it to be a distinct possibility. Then Summers is going to tell us this wasn’t transitive inflation?? The man (Summers) proves everyday how easy it is to believe he had the complete jackass gall to call up Brooksley Born, a woman every bit his intellectual superior, and attempt to intimidate her from saving markets from the derivatives crisis. The man’s ability to mesmerize himself with his own arrogance proves that to have been the case, with zero doubt.
Moses,
“transitory” inflation, not “transitive,” which you embarrassingly highlighted. There you go again.
You have enough confidence to play this market this way? That sort of invalidates just about every troll comment you have ever made?
rsm: from 2014-17, oil futures were in contango.
I just cited elsewhere the BLS documentation on confidence intervals for m/m changes in CPI. Did you not read that? For November, the inflation rate far exceeded the confidence interval.
Truly, you are an idiot.
I would like to praise Kevin Drum for this commentary on the role of the decline of the inventory to sales ratios and its implications for things like inflation. Only problem is I find his graph rather confusing. Anyone want to either provide a clearer graph or explain exactly how these figures were derived since Kevin sort of punted on that?
https://jabberwocking.com/business-inventories-are-still-well-below-normal/
https://www.nytimes.com/2021/12/10/business/economy/human-rights-export-controls.html
December 10, 2021
U.S. and Others Pledge Export Controls Tied to Human Rights
A partnership with Australia, Denmark, Norway, Canada, France, the Netherlands and the United Kingdom aims to stem the flow of key technologies to authoritarian governments.
By Ana Swanson
WASHINGTON — The Biden administration announced a partnership on Friday with Australia, Denmark, Norway, Canada, France, the Netherlands and the United Kingdom to try to stem the flow of sensitive technologies to authoritarian governments.
The partnership, named the Export Controls and Human Rights Initiative, calls for the countries to align their policies on exports of key technologies and develop a voluntary written code of conduct to apply human rights criteria to export licenses, according to a White House statement….
[ The point of Trump administration trade policy with regard to China, was from the beginning to control and limit Chinese technology development. The Biden administration is continuing and broadening the policy:
https://www.washingtonpost.com/news/wonk/wp/2018/05/04/trump-is-asking-china-to-redo-just-about-everything-with-its-economy/
May 4, 2018
Trump is asking China to redo just about everything with its economy
By Heather Long – Washington Post
The Trump administration has finally presented the Chinese government with a clear list of trade demands. It’s long and intense (there are eight sections), and President Trump isn’t just asking Chinese President Xi Jinping for a few modifications. He’s asking Xi to completely change his plans to turn the Chinese economy into a tech powerhouse. ]
ltr,
Why are you reminding us of Trump’s silly demand for those 12 “transforming the economy” changes? I would like to see Biden end the tariffs, or at least reduce most of them. But limiting certain kinds of technology flows over human rights issues is very far from and much reduced from that 12 point list of demands Trump made.
https://fred.stlouisfed.org/graph/?g=ESgw
January 30, 2018
Inventories to Sales Ratio, 2017-2021
https://fred.stlouisfed.org/graph/?g=mBet
January 30, 2018
Inventories to Sales Ratio, 2007-2021
i suspect the inverse is approximately inventory turnover (which is very firm specific)..
Drum sorts out automobiles which seem to be out sized at the moment.
looking back this stat was in this range in 2012 or so.
it has been a long time since the uaw held car buyer hostage,
https://fred.stlouisfed.org/graph/?g=JNFm
January 30, 2018
Motor Vehicle and Parts Dealers Inventories to Sales Ratio, 2007-2021
https://fred.stlouisfed.org/graph/?g=JMTj
January 30, 2018
Manufacturers Inventories to Sales Ratio, 2017-2021
https://fred.stlouisfed.org/graph/?g=JMTq
January 30, 2018
Manufacturers Inventories to Sales Ratio, 2007-2021
https://www.worldometers.info/coronavirus/
December 11, 2021
Coronavirus
United States
Cases ( 50,762,671)
Deaths ( 817,789)
Deaths per million ( 2,450)
China
Cases ( 99,604)
Deaths ( 4,636)
Deaths per million ( 3)
https://news.cgtn.com/news/2021-12-11/China-fully-vaccinated-82-5-of-people-close-to-herd-immunity-15UfETYfH5S/index.html
December 11, 2021
China fully vaccinated 82.5% of people, close to herd immunity
Over 1.16 billion Chinese people, or 82.5 percent of the country’s total population, have been fully vaccinated against COVID-19 as of Friday, said an official of the National Health Commission (NHC) at a press briefing on Saturday.
Wu Liangyou, deputy head of the disease control and prevention division of the NHC, stressed that vaccination is still the effective way to control the pandemic. He added that the NHC will continue to push the vaccination drive in China.
China will need to inoculate 83 percent of its population to achieve herd immunity theoretically, the country’s top epidemiologist Zhong Nanshan said on the same day in Guangzhou, adding he’s confident that the target will be reached by the end of this year.
Zhong Nanshan consults regularly with the faculty at Harvard Medical School, among consultations with medical faculty in Israel…, and when Zhong, who has worked to design the remarkably effective protection, detection and treatment regimes in China * finds that China is near herd immunity, I and others ever so much more knowledgeable in epidemiology know that China is very very near herd immunity.
* There has been “no death” of a vaccinated person in China.
http://www.news.cn/english/2021-12/12/c_1310367589.htm
December 12, 2021
Over 2.60 bln COVID-19 vaccine doses administered on Chinese mainland
BEIJING — More than 2.60 billion COVID-19 vaccine doses had been administered on the Chinese mainland as of Saturday, data from the National Health Commission showed Sunday.
Customization is also possible with Amazon Fire devices. Amazon has published USB drivers that allow you to connect these devices to your computer and execute all ADB functions. You may use the ADB to install stock firmware, insert files, and restart your tablet or smartphone in boot loader and recovery mode.