A couple of plots to highlight the fact that the November number on nonfarm payroll employment should be understood in the context of ongoing revisions in the data (see release here).
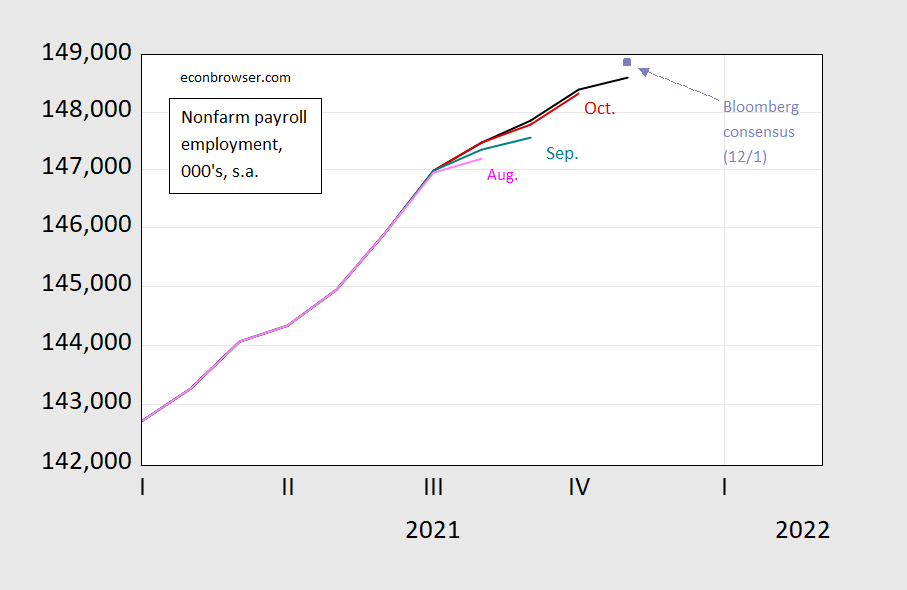
Figure 1: Nonfarm payroll employment for November (black), October (red), September (teal), August (pink), and Bloomberg consensus of 12/1 (lilac square), all on log scale. Source: BLS, various releases, Bloomberg.
So generally, revisions have been upward over the summer and last couple of releases. The mean absolute revision in employment changes going from 1st release to 3rd release from January to September of this year is 107K. That means (using 1.96) the implied change in employment from the 3rd release could be zero or could be as high as 420K, given the mean absolute revisions exhibited in the first nine months of this year. (And of course, there will be a benchmark revision coming in the new year).
The somewhat confusing result is the disparate paths for different employment measures. Civilian employment from the household survey rose smartly.
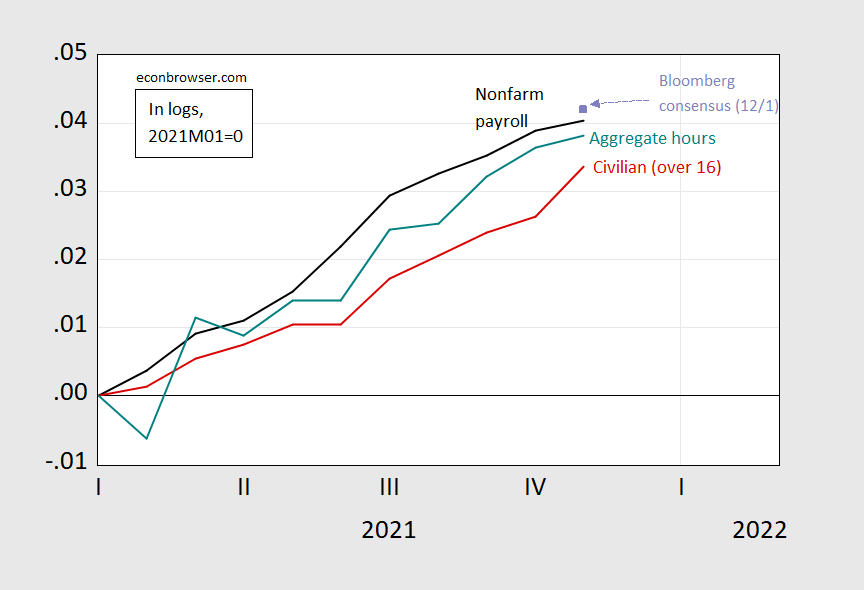
Figure 2: Nonfarm payroll employment (black), Bloomberg implied consensus for nonfarm payroll employment (lilac square), civilian employment (over 16) (teal), aggregate hours index for nonsupervisory, production workers (red), all in logs, 2021M01=0. Source: BLS, and author’s calculations.
Civilian employment rose at an annualized 8.8%, while nonfarm payroll employment rose only 1.7% (aggregate hours from the establishment survey also rose slightly faster than NFP, at 2%). The fact that average wages for nonfarm, nonsupervisory/production workers rose at 5.5% (annualized), essentially the same as in October, also further suggests that labor market strength is a bit more than indicated by NFP. Whether that will remain so in December is definitely an open question.
Furman and Powell have more on the release, as does Bill McBride at Calculated Risk.
An interesting story about long COVID.
https://www.nytimes.com/2021/12/03/health/long-covid-treatment.html
One thing that struck me was that 10-30% of those diagnosed will get long COVID. With about 50 million diagnosed in the US that would be 5-15 million cases of long COVID. They indicate that about 50% of long covid cases (2.5 – 7.5 million) end up having to quit or reduce work hours because of the effects of long COVID. Those number seems big enough that they could substantially reduce the available workforce and maybe in part explain why we are still employing fewer people than before COVID, yet see indicators of worker shortages.
https://jamanetwork.com/journals/jamanetworkopen/fullarticle/2784918
October 13, 2021
Short-term and Long-term Rates of Postacute Sequelae of SARS-CoV-2 InfectionA Systematic Review
By Destin Groff et al.
Abstract
Importance Short-term and long-term persistent postacute sequelae of COVID-19 (PASC) have not been systematically evaluated. The incidence and evolution of PASC are dependent on time from infection, organ systems and tissue affected, vaccination status, variant of the virus, and geographic region….
https://www.washingtonpost.com/health/long-covid-50-percent-lingering-symptoms/2021/11/12/e6655236-4313-11ec-9ea7-3eb2406a2e24_story.html
November 15, 2021
50 percent of people who survive covid-19 face lingering symptoms, study finds
By Linda Searing – Washington Post
At least 50 percent of people who survive covid-19 experience a variety of physical and psychological health issues for six months or more after their initial recovery, according to research * on the long-term effects of the disease, published in the journal JAMA Network Open.
* https://jamanetwork.com/journals/jamanetworkopen/fullarticle/2784918
Thank’s for the links. It’s worth noting that the incidence of negative effects after recovery from the acute phase was: 54% at 1 month, 55% at 2-5 month, and 54% at 6 month and later. In other words, most cases of “long COVID” could become permanent unless everybody gets intensive retraining. And we are not talking trivial physical and mental impairments: Chest imaging abnormality, 62.2%, difficulty concentrating, 23.8%, generalized anxiety disorder, 29.6%, general functional impairments, 44.0%, and fatigue or muscle weakness, 37.5%. That would be a very large number of people permanently disabled because of Faux news and idiot GOP politicians.
Problem with that is, it isn’t long covid. 2% will either die or have permanent damage. Having so called Symptoms 6 months is not long covid. Lazy article by NYT.
When thinking about the labor force participation rate, some use labor force divided by population, and others limit population by the same age parameters (e.g., age 16+) as is typically used for the labor force.
I prefer to start with the non-institutionalized population, which excludes the incarcerated (among others)
.
Because of data constraints, I define the age group for both labor force and N-I population as those 20 years of age and over. Since people 16-20 are not a critical demographic to the well-being of society, this is a reasonable accommodation.
And, the results:
_ _ _ _ _ Over 20s _ _ Men _ _ Women
1950s _ _ 60.1% _ _ _ 87.6%_ _ _35.2%
1960s _ _ 60.5% _ _ _ 84.2%_ _ _39.6%
1970s _ _ 62.4% _ _ _ 80.7%_ _ _46.3%
1980s _ _ 65.8% _ _ _ 78.4%_ _ _54.5%
1990s _ _ 67.8% _ _ _ 77.1%_ _ _59.3%
2000s _ _ 68.0% _ _ _ 75.9%_ _ _60.6%
2010s _ _ 65.3% _ _ _ 72.3%_ _ _58.9%
2020s _ _ 63.5% _ _ _ 69.9% _ _ _57.4% Through Oct 2021; November data did not surprise.
The rise of women as a part of the labor force is clear (as is the continual and quite steady rise of those over 55 years of age, which while included here is not broken out). So, too, is the drop-off in both the 2010s and 2020s. Among women, the decline began around 2011-12, and bottomed out in April last year, at 56.2%. Since then, it has increased steadily to 57-58% in recent months.
For men, the decline from 75-76% to 72% came in 2009, and then stabilized by 2014. It then dropped to 68.5% when COVID-19 hit, and has been hovering on either side of 70% in the past six months.
All data are available at FRED: https://fred.stlouisfed.org/
https://cepr.net/jobs-2021-12/
December 3, 2021
Unemployment Falls to 4.2 Percent in November as Economy Adds 210,000 Jobs
By DEAN BAKER
The rise in the index of aggregate hours would be equivalent to more than 630,000 jobs with no changes in workweeks.
The unemployment rate fell 0.4 percentage points in November, even though the economy added just 210,000 jobs. The drop in the unemployment rate went along with an increase in the employment-to-population ratio (EPOP) of 0.4 percentage points, corresponding to a rise in employment of more than 1.1 million in the household survey. The unemployment rate had not fallen this low following the Great Recession until September 2017.
The 210,000 job growth in the establishment survey is slower than generally expected, but it is important to note that it went along with an increase in the average workweek. The index of aggregate hours in the private sector increased by 0.5 percent in November. This would be the equivalent of more than 630,000 new jobs, with no change in the workweek.
This fits a story where employers are increasing hours since they are unable to hire new workers. We are seeing a reshuffling of the labor market where workers are looking for better jobs and employers are competing to attract workers, especially in lower paying sectors.
Declines in Unemployment Largest for Disadvantaged Groups
Nearly every demographic group saw a drop in unemployment in November, but the falls were largest for the groups that face labor market discrimination. The unemployment rate for Blacks fell by 1.2 percentage points to 6.7 percent, a level not reached following the Great Recession until March 2018 and never prior to that time. For Hispanics, the decline was 0.7 percentage points to 5.2 percent.
The unemployment rate for workers without a high school degree fell by 1.7 percentage points to 5.7 percent. By contrast, the unemployment rate for college grads fell by just 0.1 percentage points to 2.3 percent, 0.4 percentage points above its pre-pandemic low. The 5.7 percent rate for workers without a high school degree is 0.7 percentage points above the pre-pandemic low, although the monthly data are highly erratic.
The unemployment rate for people with a disability fell by 1.4 percentage points to 7.7 percent, while the EPOP rose by 1.1 percentage points to 21.5 percent. The latter figure is almost 2.0 percentage points above pre-pandemic peaks, indicating that the pandemic may have created new opportunities for people with a disability….
https://fred.stlouisfed.org/graph/?g=ykB5
January 4, 2018
United States labor force participation rate, * 2017-2021
* Employment age 25-54
https://fred.stlouisfed.org/graph/?g=r2H7
January 4, 2018
United States Employment-Population Ratio, * 2017-2021
* Employment age 25-54
https://fred.stlouisfed.org/graph/?g=Hy9b
January 4, 2018
United States Employment-Population Ratios for Men and Women, * 2017-2021
* Employment age 16 and over
https://fred.stlouisfed.org/graph/?g=wmku
January 4, 2018
Employment-Population Ratios for White, Black, Hispanic and Asian, * 2017-2021
* Employment age 16 and over
What is more shocking? That this punk thought the doctor would not notice he was about to give a COVID-19 vaccine to a fake arm? Or that people are actually paying $1500 for this scam in order to get the vaccine for free?
https://thehill.com/changing-america/well-being/prevention-cures/584189-man-caught-trying-to-use-fake-arm-to-get-vaccine
Hiring in transportation and warehousing has been running hot, up 5.6% in the last 12 months (2.9% in the last 3 months) vs 4.1% for total non-farm employment. Employers in the sector are trying hard to keep up with demand.
So far, not enough: https://fred.stlouisfed.org/graph/?g=Jvfl
Interesting chart. Employment in transportation and warehousing was the same at the end of 2012 as it was at the beginning of 2001. Yes we did see some increase for the next 7 years but even before the pandemic we seemed to have less logistic workers per capita.
https://fred.stlouisfed.org/graph/?g=tSWc
January 15, 2018
Transportation & Warehousing and Post Office Employment, 2017-2021
https://fred.stlouisfed.org/graph/?g=Gah1
January 15, 2018
Real Average Hourly Earnings in Transportation and Warehousing, * 2017-2021
* Production and nonsupervisory employees
(Indexed to 2017)
https://fred.stlouisfed.org/graph/?g=GaCG
January 15, 2018
Transportation and Warehousing Employment as a share of Total Private Employment, 2000-2021
Is it just malpractice not to report that the establishment survey has a 90% confidence interval of 110,000 and for the household survey, it’s plus-or-minus 500,000?
Why do you think these heavily adjusted numbers and changing methodologies have any relation to the real world?
Are you just arguing about the number of angels that can fit on the head of a pin?
Do you have a shred of statistical credibility, when you steadfastly refuse to report standard errors? Is this about stubbornness?
Have you not noticed that Menzie has noted this? Or are you too busy admiring what a jerk you can be? Run away little troll.
rsm,
You ate becoming increasingly nauseating, if not outright effing insane.
Just exactly who are you accusing of “malpractice,” which you seem to suggest is the least of it? BLS? Menzie? Other commentators? Both Menzie and Calculated Risk noted that these numbers are regularly revised, recently often upward. Looks to me that there has been plenty of noting of lack of certainty about these numbers. What would be added by noting some sort of standard error here? You cannot even keep straight when your point is relevant and when it is not, while proclaiming some obviously absent superior knowledge of statistics. Oh, where did you obtain this flawed knowledge you have? The same Mystery University where some people some here have studied Womens’ Studies and Underwater Basket Weaving?
I wonder if this twit does this to other economic blogs. I doubt it but even if he did – he would be banned in a heartbeat.
Rig count was flat (both oil and gas). Frac spreads (combined, they don’t break those down to oil and gas) down 3.
https://rigcount.bakerhughes.com/na-rig-count/
https://www.youtube.com/watch?v=uEq2x4Zw_q8
Can’t read too much into weekly data–lots of noise, based on the timing of moves–might be up next week. Plus maybe we are starting to head into winter slowdown (just weather related, harder to operate). But disregarding these caveats, data not great for those who favor US production growth. Especially, as these were decisions made when oil was at $80.
A.,
Ah, noise. Yes, it is highly likely that the discovery of the omicron variant had nothing to do with the largest decline of oil prices in a day for the year. Just noise. Sheesh.
OK State got knocked out of national championship contention by Baylor 21-16. All eyes to the ATL to see if Georgia can send ALABAMA packing. Go Dogs!
You may or may not have heard of Enoch Powell who delivered the “Rivers of Blood” speech in the UK during the late 1960’s. It was a racist anti-immigration screed that would remind folks of Stephen Miller. Powell was sacked by his own Tory government.
It turns out that this was the motivation behind McCarthy writing Get Back.
Powell was a elitist con man. Rivers of blood all right. Not where you expect.
NFP struggles to keep up with new business creation. There it is. I suspect as household employment slows significantly next year, NFP will still be chugging at higher rates. I see upward revisions as well. Embarrassing for the BLS, but what happened in 2020 was not expected.