Gasoline prices hit new (nominal) highs. But the usage of gasoline per unit GDP (and in absolute terms) has declined since 2008.
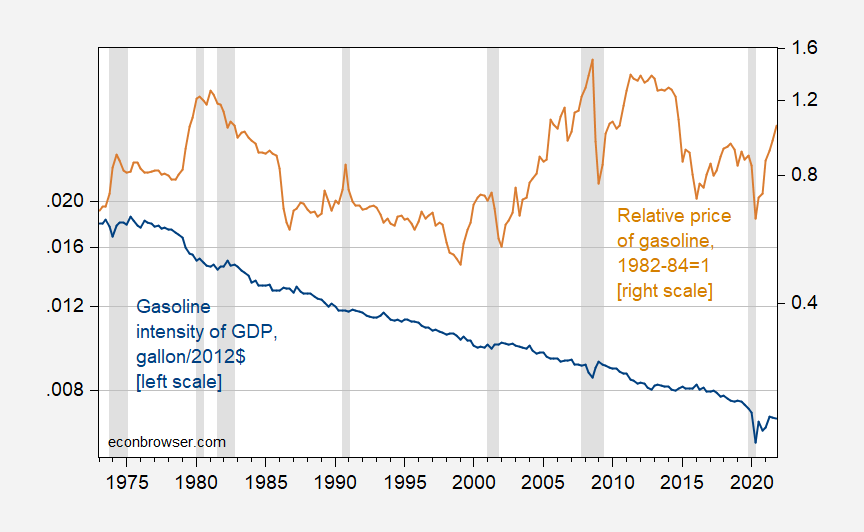
Figure 1: Gasoline supplied to GDP ratio, in gallons to Ch.2012$ (blue, left log scale), and ratio of CPI-gasoline to core CPI, 1982-84=1 (brown, right log scale). NBER defined recession dates, peak-to-trough, shaded gray. Source: DOE EIA, BEA, BLS via FRED, and author’s calculations.
The ratio for gasoline to GDP has declined by about half since 1979. The trend decline persists during times of both high and low relative gasoline prices.
In non-normalized and nominal terms:
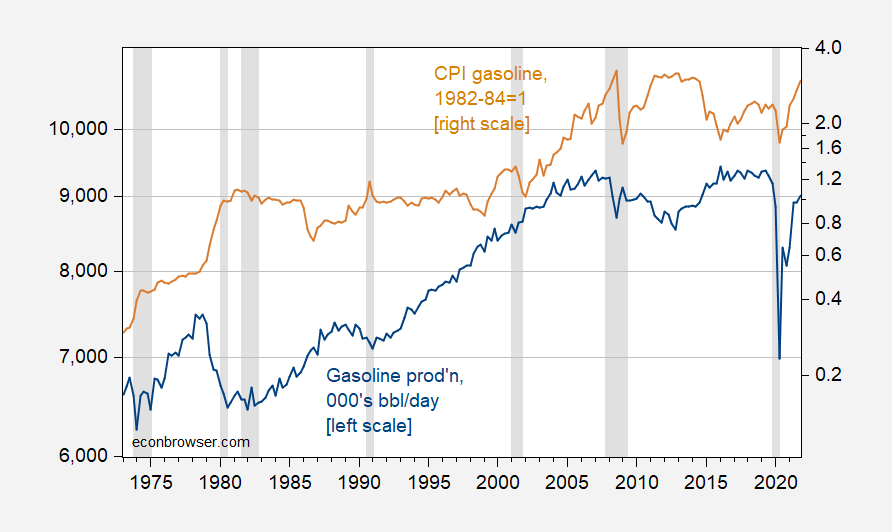
Figure 2: Gasoline supplied, in thousands of bbl/day (blue, left log scale), and CPI-gasoline, 1982-84=1 (brown, right log scale). NBER defined recession dates, peak-to-trough, shaded gray. Source: DOE EIA, BLS via FRED, and author’s calculations.
https://jabberwocking.com/raw-data-us-spending-on-gasoline/
Kevin Drum made a similar point on the spending on gasoline relative to GDP.
I’ve been checking what does the Edelstein-Kilian VAR tell us about real PCE growth given various paths of energy prices in 2022. If the latter increasy by 100% from Jan to Dec one may expect real PCE to stay flat during the reminder of the year (close to the current level observed for Jan). Of course this is on aggreagte level. Lower income households would cut spending.
P.S. As I remember there used to be some entries on Edelstein-Kilian method on Econbrowser.
They were reporting an unexpected rise in oil inventories today. Maybe gasoline demand is more elastic than people think??
I am shamefully driving halfway across town for sandwiches tonight. It’s very stupid but I just feel too lazy to cook sometimes. On top of it it’s one of those snob coffee places that shafts you on prices $9 for a sandwich. I’ll have my drink at home and save $1.50 on that. That’s how I’m rationalizing it.
This is good news for lots of reasons.
Some sectors and firms will be hit harder than others, of course. All the big winners from the shift to at-home shopping rely on delivery. Delivery had already gotten more expensive, brick-and-mortar is back in business and a shift back to service spending is underway – de-FAANGing the economy.
Auto makers have shifted output more heavily to big (higher profit) vehicles, a bad match to high fuel costs.
Container rental cost has normalized a good bit, but now bunker fuel costs will make long ocean delivery more expensive. Probably good for North America’sfactory sector relative to Asia.
Is Spring Break over? In any case, vacation travel will be lots more expensive witht $4 gasoline.
This is good, but it may be underestimating one particular facet: the commute to work. In 2003, the NRC reported the commute was 26 minutes (https://www.nrc.gov/docs/ML1006/ML100621425.pdf). By 2019, this had increased (https://www.census.gov/newsroom/press-releases/2021/one-way-travel-time-to-work-rises.html). The people who can telecommute have an advantage, but this largely relates to services. For manufacturing, unless it is computer-aided enough so that it can be programmed from a considerable distance, this is not good news. So the aspect of gasoline being less needed, and thus a smaller contributor to inflation, (or unemployment) may not prove to be true (especially in a place like Oklahoma, which does not provide ethanol at the pump), until a major transition effort gets underway.