Following up on Friday’s post (“When is a recession not a recession?”) by Jan P.A.M. Jacobs, Samad Sarferaz, Jan-Egbert Sturm and Simon van Norden , here’s a picture in levels of some of the alternative GDP measures, along with two key variables followed by the NBER Business Cycle Dating Committee (aggregate hours, personal income excluding transfers), at the quarterly frequency.
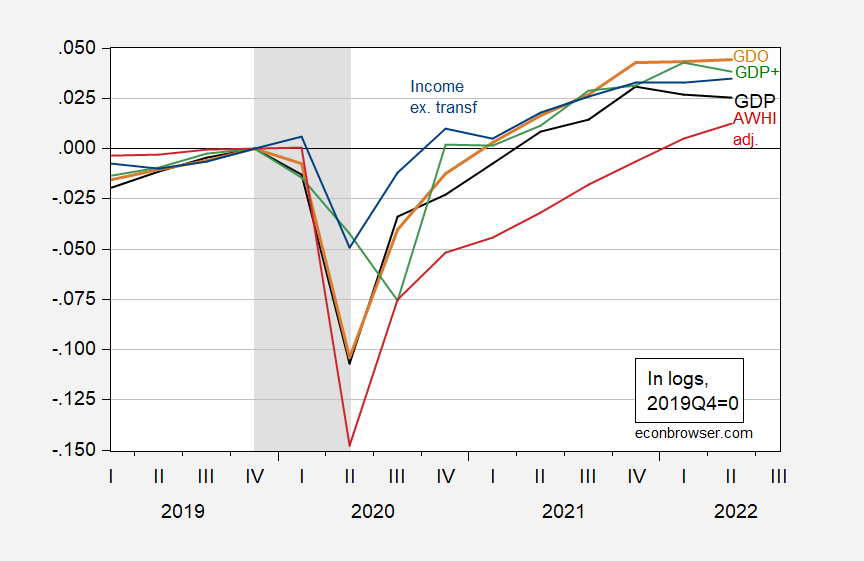
Figure 1: GDP (black), GDO (tan), GDP+ ( green), aggregate weekly hours index (red) and personal income excluding transfers (blue), all in logs 2019Q4=0. NBER recession peak-to-trough recession dates shaded gray. Note the Aggregate Weekly Hours Index has been adjusted to incorporate the preliminary benchmarked series, as discussed in this post. GDP+ converted to level using 2016Q1 as base, and subsequent growth rates. Source: BEA Q2 2nd release, Philadelphia Fed, BLS, NBER, and author’s calculations.
Note that I have not included GDP++. However, as noted by Jacobs et al., GDP++ matches GDO pretty closely for Q1-Q2 growth, so that you can infer roughly the same contours for GDP++ as for GDO shown above — i.e., weak but not negative growth.
GDPNow Q3 nowcast is 1.6%, St. Louis Fed is 0.9%, Goldman Sachs is 1.0% (all 8/26). Deutsche Bank forecast is at 2.8% (as of 8/26).
Whether we might be in a slight recession or simply be growing rather slowly struck me as less important than worrying about traditional Federal Reserve policy leading to a meaningful recession. There are important economic weaknesses even with a remarkably low unemployment rate, such as the number of households behind in paying utility bills. These are not households that will fare at all well with the Fed continuing to slow the economy. Also, along with James Galbraith, I am worried structural economic limits could for a time limit the effect of Fed rate increases. Can exports hold if the dollar keeps increasing in value with Fed rate increases? Can a seemingly already very expensive housing market continue to hold? What bolsters the economy if housing and exports fail to hold?
https://fred.stlouisfed.org/graph/?g=z21W
January 15, 2018
Shares of Gross Domestic Product for Private Fixed Nonresidential & Residential Investment Spending, Government Consumption & Gross Investment and Exports of Goods & Services, 2017-2022
https://fred.stlouisfed.org/graph/?g=z21I
January 15, 2018
Shares of Gross Domestic Product for Private Fixed Nonresidential & Residential Investment Spending, Government Consumption & Gross Investment and Exports of Goods & Services, 2017-2022
(Indexed to 2017)
https://fred.stlouisfed.org/graph/?g=AuPx
January 15, 2020
Shares of Gross Domestic Product for Private Fixed Nonresidential & Residential Investment Spending, Government Consumption & Gross Investment and Exports of Goods & Services, 2020-2022
https://fred.stlouisfed.org/graph/?g=AuPM
January 15, 2020
Shares of Gross Domestic Product for Private Fixed Nonresidential & Residential Investment Spending, Government Consumption & Gross Investment and Exports of Goods & Services, 2020-2022
(Indexed to 2020)