Or, a post for Steven Kopits.
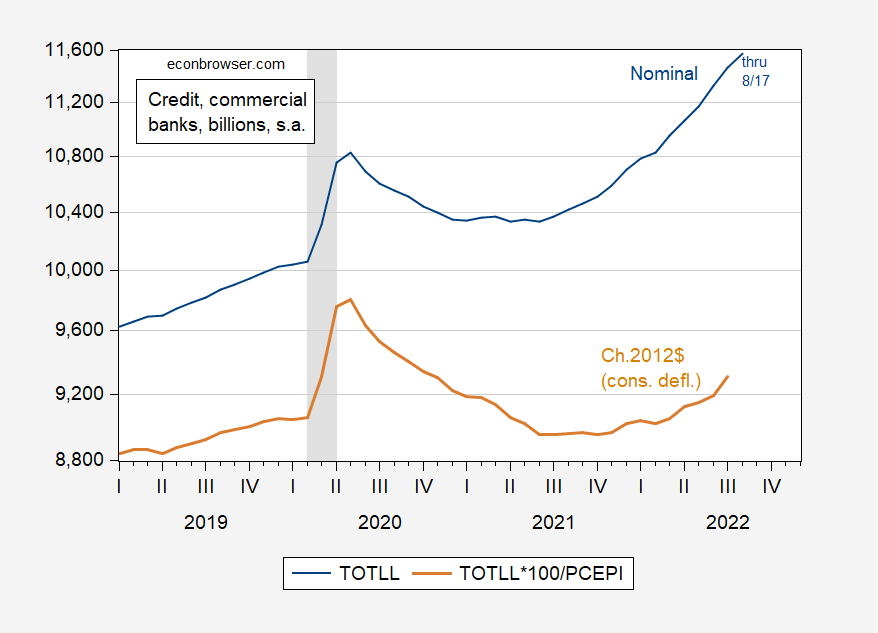
Figure 1: Loans and Leases in Bank Credit, All Commercial Banks, in billions $, s.a. (blue), and in billions Ch.2012$, s.a. (tan), both on log scale. Real series PCE price index deflated. NBER defined peak-to-recession dates shaded gray. Source: Federal Reserve via FRED, series TOTLL, BEA via FRED, NBER, and author’s calculations.
In the run-up to the 2007 recession, nominal and real lending growth were decreasing. As of July (for real) and August 17 (for nominal), growth rates are rising. (Note that because I have plotted both series on a log scale, an increasing slope denotes a rising growth rate; this is an attribute of logs that Jim Hamilton has highlighted in the past).
I welcome any cogent arguments, based on data, for why we should consider ourselves in August (or in H1) in a recession, from the usual suspects.
Addendum, 8/29, 6:45AM Pacific:
Steven Kopits writes: “Well, banks have gone on a lending spree due to low interest rates. Okay, not too hard to understand. If the view is that they continue to issue loans at this pace with rising interest rates, well, no. Lending has that typical exponential growth shape that precedes particularly ugly financial crises.”
Well, I can’t predict whether there will be a financial crisis, but the following graph belies the assertion that rates are particularly low.
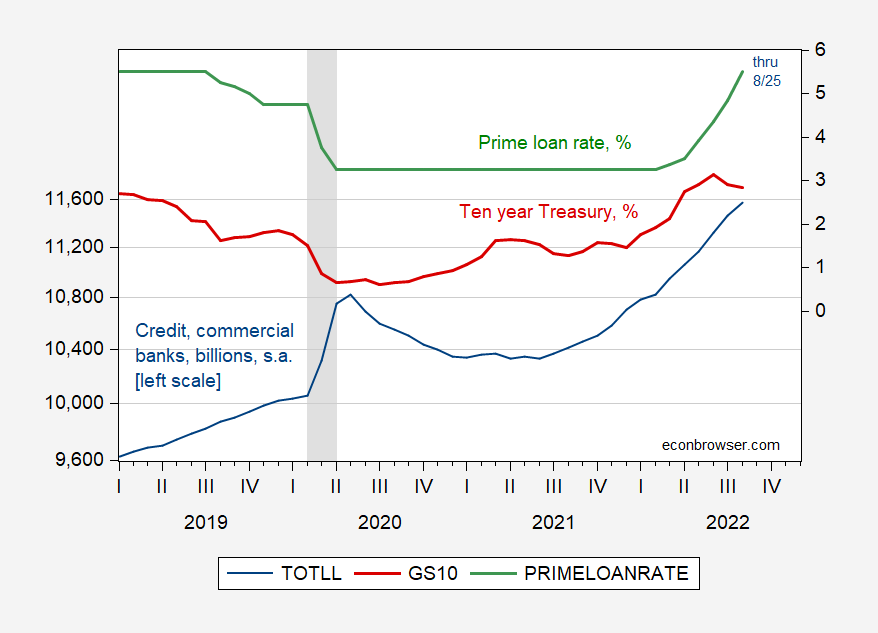
Figure 2: Loans and Leases in Bank Credit, All Commercial Banks, in billions $, s.a. (blue, left log scale), and ten year Treasury yields, % (red, right scale), and Prime loan rates, % (green). RNBER defined peak-to-recession dates shaded gray. Source: Federal Reserve via FRED, NBER, and author’s calculations.
So, loan growth has accelerated as interest rates have risen (in fact, haven’t we been discussing on this weblog rising rates for the past year?).
https://fred.stlouisfed.org/graph/?g=pkLF
January 15, 2018
Interest Rates on United States High-Yield BB and Euro High-Yield bonds, 2017-2022
https://fred.stlouisfed.org/graph/?g=sKvA
January 15, 2020
Interest Rates on United States High-Yield BB and Euro High-Yield bonds, 2020-2022
The yield on BB rated corporate bond has a credit spread that is typically 3% above the corresponding government bond rate. The rates on German government bonds (Euro) has been lower than the rate on US government bonds (dollar) but both government bond rates have been rising. So a better comparison would be these rates v. the interest rate on the corresponding government bond.
It is interesting to note that your dollar rate rose quite a bit from the beginning of the year to the end of June but has been retreating a bit since. Which is precisely the opposite of the picture that Princeton Steve has been painting. Now I have said before that Princeton Steve lies a lot but it may be the case that he is just not very bright.
What if banks are lending more because interest rate arbitrage is favorable to them and they can limit their loans to the recession-proof (such as fracking companies)?
Can your data ever confirm or deny that hypothesis?
Do you even know what interest rate arbitrage is? But your point is that banks are reducing their loans to certain sectors which explains why they are lending more? How dumb are you?
it is your hypothesis. it is you who should deny or confirm. it is doubtful you can.
The yield curve is flat right now. A flat yield curve is generally seen as reducing the interest margin of banks, since they borrow short and lend long. There is some evidence that banks’ overall margins from lending are not heavily dependent on term spread, but a flat curve is, in itself, a disincentive to lending.
So I assume, in using the term “interest rate arbitrage”, you have some interest rate spread in mind other than the term spread. Otherwise, you’ve simply parroted something you’ve heard without any idea what it means. Again.
So, what rate spread do you have in mind as generating this arbitrage?
It is hard to keep up with all the things Stevie gets wrong. In the linked comment, Stevie says ”
“…months of completed homes remains near record lows.”
Now, I don’t know what “months of completed homes” means, but I can think of two possibilities. One is the average time it takes to complete a new home, which is about as far from a record low as you can get. The other is the number of homes completed, which is nowhere near a record low, either. Here are the data on homes completed:
https://fred.stlouisfed.org/graph/?g=TbOc
Stevie, you want to clear that up for us? You did have an actual fact in mind, yes? I’d be shocked to learn you were just making stuff up. A consultant wouldn’t do that, would he?
I would like it if Stevie could manage to tell us when mortgage rates rose v. fell. He is clearly mixed up on this one as is his BFF JohnH.
Psst…don’t tell pgl this, but Mortgage News Daily is showing the 30 year mortgage at 5.95%, up from 5.71% a week ago and 5.25% from two weeks ago.
https://www.mortgagenewsdaily.com/mortgage-rates/30-year-fixed
As we know, pgl mocked anyone who thought mortgage rates were going up last week…
And as we know, pgl has to be right always or he throws a hissy fit!
Yes we know Johnny boy that subprime rates are higher than other rates. I also noted how what Freddie Mac is reporting rose. In your pathetic attempts to accuse me of lying you are accomplishing only one thing – showing everyone what a pathetic lying clown you are. But relax – everyone already knows you lie a lot and you are dumber than a rock.
“I also noted how what Freddie Mac is reporting rose.” Sure, sure, pgl. You did note that Freddie Mac reported that rates rose…but only after you mocked others for noting the rise in rates a day earlier.
pgl doesn’t know which way is up, but sure knows how to rewrite history!
JohnH
August 29, 2022 at 11:55 am
Baby boy Johnny has gone absolutely pointless. WHAAAA, WHAAAA, WHAAAA!
I see you had trouble reading your own link:
This page provides average 30 year fixed mortgage rates from several different surveys including Mortgage News Daily (daily index), Freddie Mac (weekly survey), Mortgage Bankers Association (weekly survey) and FHFA (monthly survey).
Try to follow along little boy. Your own link shows the weekly survey data from Freddie Mac (what FRED reports) and it is exactly what I have said. Exactly.
Poor little Johnny – after all these years, he still has not passed preK reading.
“The other is the number of homes completed, which is nowhere near a record low, either.”
These series show a little volatility but is generally trending up. Of course you knew that but something tells me Stevie has trouble reading the simplest of graphs.
“Supply of unsold new houses spiked to nearly 11 months of sales, on this surge in inventory and the collapse in sales. This was the highest since the worst months of Housing Bust 1 in late 2008 and early 2009:”
https://wolfstreet.com/2022/08/23/sales-of-new-houses-collapse-in-the-west-by-50-inventories-supply-spike-to-high-heaven-worst-since-peak-of-housing-bust-1/
“The National Association of Home Builders/Wells Fargo Housing Market Index (HMI) fell six points in August to 49. This past month’s drop marks the eighth consecutive decline for the HMI and marks the first time since May 2020 that this closely watched index has fallen below the key 50 breakeven level, which indicates that more home builders currently rate sales conditions as poor than those who rate conditions as good.”
https://www.fxstreet.com/analysis/nahb-housing-market-index-signals-pessimism-in-august-202208152353
Your point? Stevie mentioned “months of completed homes”, not unsold homes. Completions have to do with construction. Sales with, ya know, sales.
Or are you back to “bad, bad, bad” without regard to the issue at hand?
And if you’re sure about bad, bad, bad, feel free to screw up a teeny, tiny bid of courage and take the bet. After all, you screw up just about everything.
How do you interpret the data, MacroDuck? Go ahead, give it a shot! I expect your answer will be “phenomenal, great, wonderful news!”
I mean, housing is only 15-18% of GDP, so it’s immaterial, right? Or, if it does matter, and the news is bad, then it’s best the cherry pick the data and ignore housing altogether
First of all it is your BFF Princeton Steve that is misinterpreting the data with babble so stupid that it might make even a Village Idiot look smart by comparison. But this?
“housing is only 15-18% of GDP”
Have you ever checked the BEA NIPA figures? FRED has them and residential investment is closer to 5% of GDP. So WTF did you use to come up with 15% to 18%? Oh yea your new BFF told you that. Got it!
I evaluate the data as saying there will not be three quarters of real GDP contraction in the first three quarters of 2022. But you knew that.
And I’m pretty clear about my views on the economy, good and bad. What I don’t do is unsupported, drive-by trash-talk.
I am amused by Johnny claimed “housing” amounts to between 15% and 18% of GDP. I know where the figure comes from – it’s from the National Association of Homebuilders website:
http://www.nahb.org/news-and-economics/housing-economics/housings-economic-impact/housings-contribution-to-gross-domestic-product
From the same web page:
Residential investment (averaging roughly 3-5% of GDP)
Consumption spending on housing services (averaging roughly 12-13% of GDP)
The context of Johnny’s mention of housings share of GDP is his ardent desire for the U.S. economy to crash. My amusement stems from Johnny’s attempt to use the biggest Shar of GDP he could find for housing to make it scary. OK, fks, anybody want to guess which of the broad components of housing shows the greatest cyclical variability? Hint: the larger consumption component is largely imputed from occupancy. You just live in a house built years ago and it counts as housing consumption in the calculation of GDP.
In order for Johnny’s 15-18% scary number to be scary, the biggest component ought to be cyclically unstable. Here’s the picture:
https://fred.stlouisfed.org/graph/?g=TdBj
The larger consumption component imparts less variability to GDP than does the small investment component. In fact, the consumption component often remains positive during recession. That’s why professionals focus on housing investment, which in the most recent quarter was 4.7% of GDP, not 15-18%.
Johnny, Johnny, Johnny, why must you embarrass yourself like this? Well, unless someone pays you for this dreck.
MacroDuck and pgl are trying to trivialise the importance of housing to GDP, mostly likely to gild the lily for their favorite political party ( we know that they are both Democratic partisan hacks.)Two of GDPNow’s twelve input sources include housing starts and new home sales.
If you see an “impartial” analyst ignoring housing, you have to wonder about their agenda and their impartiality.
You do realize Johnny boy has flunked preK reading many time I hope.
Macroduck
August 29, 2022 at 2:34 pm
OK you too picked up on “housing services”. I went to that source that Johnny did not mention but you also found. Not only has residential investment in real terms has increased over the last year so too has housing services kept pace with inflation/
Look – Johnny boy has the habit of pulling headlines from sources he cannot bother to check or better cross reference to BEA’s reliable data.
Then again his new BFF Princeton Steve does this misleading and lazy “analysis’ routinely.
JohnH’s writing skills are even worse than Stevie’s are so I decided to see where this lying idiot came up with his housing is 15% to 18% of GDP. The National Home Builders Association of course! After all – what does the BEA know?!
https://www.nahb.org/News%20and%20Economics/Housing%20Economics/Housings%20Economic%20Impact/Housings%20Contribution%20to%20Gross%20Domestic%20Product#:~:text=Housing%E2%80%99s%20combined%20contribution%20to%20GDP%20generally%20averages%2015-18%25%2C,remodeling%2C%20production%20of%20manufactured%20homes%2C%20and%20brokers%E2%80%99%20fees.
Housing’s combined contribution to GDP generally averages 15-18%, and occurs in two basic ways:
Residential investment (averaging roughly 3-5% of GDP), which includes construction of new single-family and multifamily structures, residential remodeling, production of manufactured homes, and brokers’ fees.
Consumption spending on housing services (averaging roughly 12-13% of GDP), which includes gross rents and utilities paid by renters, as well as owners’ imputed rents and utility payments.
Including owners’ imputed rent (an estimate of how much it would cost to rent owner-occupied units) in GDP has long been a standard practice in national income accounting. Were owners’ imputed rent not included, an increase in the homeownership rate would cause GDP to decline.
So residential investment is not nearly 15%. Besides residential investment is not cratering as Princeton Steve claims. The other components are noted below this:
‘The table linked below shows housing’s share of both investment and consumption in the annual GDP accounts. All GDP components are adjusted for inflation’ (Excel file)
Housing Services are rising too.
Of course Johnny boy cannot be bothered to check the data. Had this lazy idiot done so – the data would make your argument even strong.
By the way, I recently posted a link to a source for Bloomberg’s Credit Impulse Index for China (which didn’t look great, but had stopped falling).
Here is a like to the U.S. Credit Impulse Index:
https://en.macromicro.me/collections/9/us-market-relative/38437/us-credit-impulse-index
Readings above 5 are not all that common. Duing the three recessions for which we have data, the Index turned negative prior to recession except for the Covid recession. The latest reading is above 5.
If any of our troll chior would like to claim that borrowers are scrambling to shore up cash holdings because a pandemic is on its way, as happened just before the Covid recession, well I’m just giddy to see you try.
For those with a serious interest in making use of credt impulse measures, a high reading means credit markets may be driving growth. A more moderate but positive reading means credit is adequate, not co straining growth. A negative reading may not mean credit is a principal cause of a slowdown, but it is a contributing factor – credit is making things worse.
It’s interesting that Bloomberg’s Index is far from showing credit as a contributing factor to slower growth despite the rise in mortgage rates. Interesting, but not mysterious. As Menzie’s figure 1 shows, credit growth is still healthy. It is inventories which have been the main drag on GDP, and while inventories are often financed with borrowed money, any contraction in credit use due to inventory reduction hasn’t been enough to harm credit growth much. The math of inventories’ contribution to GDP probably helps explain that. Change in the change, and all that. Slower output growth wthout slower credit growth pushes the index up.
Jay Powell’s “we ain’t done yet” speech at Jackson Hole has made headlines and caused a kurfuffle in financial market prices. An address which has garnered less attention but which has more lasting implications comes from Agustin Carstens:
https://www.bis.org/speeches/sp220826.htm
Global economic regime change and its implications for growth, inflation and proper policy. True “big idea” stuff and the background for Powell’s speech.
Carstens isn’t from a G7 country, so he doesn’t get much press, but he has a brain the size of a planet. Like Marvin, without the mopey attitude.
This one comment from Princeton Steve is getting a lot of feedback. Of course the misrepresentation of mortgage rates, the hyperbole as in “cratering”, and the silliness over how he thinks the change in the deficit is the same thing as fiscal restraint ranks this comment as one of his most absurd.
Lindsey “rule of law” Graham turned mob enforcer:
https://www.msn.com/en-us/news/politics/sen-lindsey-graham-said-if-trump-is-prosecuted-for-mishandling-classified-information-there-will-be-riots-in-the-streets/ar-AA11d3g6?ocid=msedgdhp&pc=U531&cvid=a010382915f83430369b29b39375e485
Republican Sen. Lindsey Graham said Sunday there will be riots if former President Donald Trump is prosecuted over his handling of classified materials.
Let’s stop pretending that girly man Lindsey ever care about the rule of law, national security, or even our democracy.
Oh my, it seems Menzie made this “post for Steven Kopits” available for the public. Or maybe there was a typo and should instead read “post for Menzie Chinn’s ego”?
An oversight either way.
Econned: No, no oversight. That was intentional.
Menzie Chinn:
Oh, I’m quite aware. Shall I assume your obliviousness to sarcasm to be intentional as well?
Econned: I just feel juvenile sarcasm is best addressed with straightforwardness.
Menzie Chinn:
I combined straightforwardness with the sarcasm.
I do find your reply very interesting because my sarcasm was in response to (yet another of) your juvenile ego-driven attempts of petty one-upmanship. Fun!
econned, why do you troll on this site with multiple monikers in order to defend your comments? why the attempt at misrepresentation?
I wonder if he is dating Mary Rosh.
Econned is just verifying that he is the second most pompous person posting here, after me, of course. Nobody here can out pompous me, even poor CoRev who tries so hard but just cannot even get off the ground.
Gee – time for Econned to defend the stupidity of his fellow trolls. That is what you do best. In fact that is all you do.
Well, banks have gone on a lending spree due to low interest rates. Okay, not too hard to understand. If the view is that they continue to issue loans at this pace with rising interest rates, well, no. Lending has that typical exponential growth shape that precedes particularly ugly financial crises.
If we are to look back at the historical record, I would note that commercial lending did not begin to decline until May 2008, five months into the Great Recession.
Another take on this issue is household debt, which is a larger sum, $16.5 trn in Q2 2022. During the Great Recession, household debt peaked in Q3 2008, that is, three quarters into the recession. Mortgage debt also peaked in Q3 2008 and did not recover that level, astoundingly, until Q1 2019, eleven years later! Now that’s a depression!
The recent rise in household debt has come principally in mortgages, which have been rising by $250 bn / quarter since 2021 Q1, and total debt has been rising by $300 bn / quarter over the same period. Credit card debt and auto debt are each up $100 bn in the last year.
So, if you’re trying to make the case that all is well because debt continues to rise, well, the historical record does not support that view without qualification. If instead you were trying to make the case that the economy goes to hell in Q4, well, that’s another potential read of the data.
https://fred.stlouisfed.org/series/TOTLL
https://www.newyorkfed.org/microeconomics/hhdc.html
Steven Kopits: As I wrote in the post, lending was accelerating thru August, while decelerating into the Great Recession. That is true (please verify for yourself if you can).
Second, you write: “Well, banks have gone on a lending spree due to low interest rates. Okay, not too hard to understand. If the view is that they continue to issue loans at this pace with rising interest rates, well, no. Lending has that typical exponential growth shape that precedes particularly ugly financial crises.” I’ll add a graph to note that your characterization of rates now is incorrect (see addendum).
“lending was accelerating thru August”
His own FRED link confirms that lending has been rising through 8/17 even as Steve tells us interest rates are very high. Stevie is even more confused than rsm.
could it be a lot of cash to do something with:
https://fred.stlouisfed.org/series/M1SL
https://fred.stlouisfed.org/series/M2SL
M1 is mostly checking accounts not cash.
M2 includes a lot of savings accounts.
Dude – even a basic Money and Banking course would have warned you not to call this Cash.
Dude – learn to use FRED as it shows the components of M1 and M2:
https://fred.stlouisfed.org/series/CURRSL
Currency Component of M1
Cash is just over $2 trillion, which is about 10% of M1.
Yet again Anonymous is competing with CoRev for least intelligent commenter here. So weird that both of them claim to have had security clearanace, gag! I am glad we now have Super Secret Agent Moses around to take care of things instead of these two goofballs, :-).
Incredibly ironically you are not the first person to accuse me of being a spy. Though I’m nearly certain the other time was less mocking.
I find it strange you seem to be more curious about my occupation since the time-point I uncovered your blogging pal’s real name and occupation. I would think with my respect for his privacy you might respect mine. So much for assuming those in the ivory towers exhibit much class in their social interrelations. You’ve almost made me glad I was too cowardly to pursue a masters.
For the record, grapevine is as far as my security clearance gets me. Seemingly deeper knowledge on the Ukraine and Russia deep state than Barkley has. Who knew??
Moses,
Given the high level of your security clearances, which of course forbid you from saying a single thing about what you currently do, of course you will deny being a spy. We all know that, :-).
“banks have gone on a lending spree due to low interest rates.”
Excuse me but you have been saying mortgage rates have been rising non-stop. They did fall a bit after June but YOU kept claiming they were rising. Do you just make up stuff as you go or what?
That does seem to be the way it’s done by the right wing. When the facts don’t fit the narratives/models, then you discard them and make up your own “facts” that does.
That is exactly what Princeton Steve and his new BFF JohnH does all the time. Making up junk as they go.
“If we are to look back at the historical record, I would note that commercial lending did not begin to decline until May 2008, five months into the Great Recession.”
steven, you have called a recession from the first and second quarters of 2022. so we are about 9 months into your “recession”, and bank lending has been accelerating since about third quarter of 2021. it is tough to square your analysis with the data.
Stevie, when you’re in a hole, STOP DIGGING! You have repeatedly demonstrated that you don’t know enough about economics to debate economics, and here you’ve done it again:
“Lending has that typical exponential growth shape that precedes particularly ugly financial crises.”
You’ve made a claim about the rate of change in lending, apparently without even checking whether your claim is true. The growth rate in lending is rising, but is not high by historical standards:
https://fred.stlouisfed.org/graph/?g=Tdbw
Stevie, getting simple thinks like rates of change so wrong is just crazy. Don’t guess – look stuff up. Your seem to assume the world is just naturally going to conform with whatever loopy notion pops into your head. It doesn’t.
While we’re at it, there are all kinds of ways to check whether borrowing is generating the kind of risk of overheating and collapse that Stevie so glibly assumed. Household debt service as a share of disposable income is one of them. Here ya go:
https://fred.stlouisfed.org/graph/?g=SgCw
Well that’s looking pretty non-stressful, what with being historically low and all.
The rule of thumb that Stevie has messed up here, about rapid credit growth leading to busts, has been formalized by, among others, Mian, Sufi and Verner:
https://academic.oup.com/qje/article-abstract/132/4/1755/3854928?redirectedFrom=fulltext
The idea is that households pull consumption from the future into the current period through the use of credit. Too much of that and consumption falls off in the future. In fact, there was an acceleration of durables consumption during the worst of the pandemic, but it wasn’t funanced with household borrowing. In fact, the household saving rate rose:
https://fred.stlouisfed.org/graph/?g=TddQ
Is the Mian, Sufi, Verner thing of pulling too much consumption forward likely to be a problem? Quite possibly. Will it be due to excess credit use? Lord, no! You’d have to be completely unfamiliar with the data to think a thing like that.
By the way, his stuff has been discussed in comments here a few times. All one has to do is pay attention. I wish that was why people participate in comments, but clearly, many frequent commenters don’t care at all about how the economy actually works. Do they, Stevie?
Their QJE paper is a must read. Let me cite one small part:
An increase in the household debt to GDP ratio predicts lower GDP growth and higher unemployment in the medium run for an unbalanced panel of 30 countries from 1960 to 2012. Low mortgage spreads are associated with an increase in the household debt to GDP ratio and a decline in subsequent GDP growth, highlighting the importance of credit supply shocks.
I don’t think Stevie even knows how to express debt relative to anything such as GDP even if you have. Mortgage spreads are things you and I both check and report on. Again – I doubt Stevie even has a clue what they are.
Steve Kopits is simply going to ignore this comment.
Well at least Stevie has stopped trying to defend his confusion over mortgage rates. That task has been outsourced to his new BFF JohnH.
https://jabberwocking.com/raw-data-retail-profits-in-a-post-pandemic-world/
Kevin Drum captures retail industry profits in inflation adjusted terms. Yes they have dropped a bit since the beginning of the year but are still well above trend.
Maybe we should outsource the rebutting all of those misleading comments ala Princeton Steve to Kevin Drum!