Industrial and manufacturing production both at 0.4% m/m growth, above consensus (0.1% and 0.2%, respectively) in September, showing resumed growth. This is the picture of key macro indicators followed by the NBER Business Cycle Dating Committee, plus IHS-Markit monthly GDP.
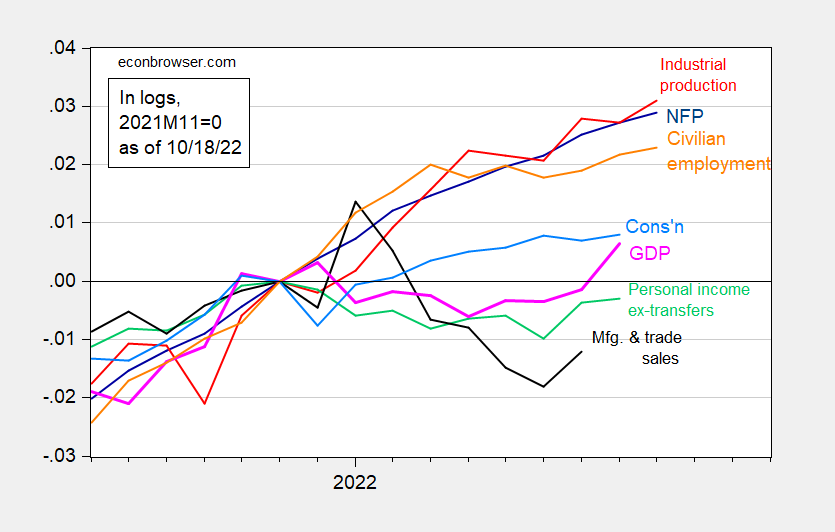
Figure 1: Nonfarm payroll employment, NFP (dark blue), civilian employment (orange), industrial production (red), personal income excluding transfers in Ch.2012$ (green), manufacturing and trade sales in Ch.2012$ (black), consumption in Ch.2012$ (light blue), and monthly GDP in Ch.2012$ (pink), all log normalized to 2021M11=0. Source: BLS, Federal Reserve, BEA, via FRED, IHS Markit (nee Macroeconomic Advisers) (10/4/2022 release), and author’s calculations.
GDP as reported in the annual benchmark revision reported at end-2022 (which revised the series up through 2022Q1) shows two quarters of decline. However, as noted elsewhere, this is not the official definition of a recession in the United States; rather that determination is made by the NBER’s Business Cycle Dating Committee, based upon a wide variety of indicators, and only secondarily on (oft-revised) GDP. Here is the corresponding picture, showing official GDP (through Q2), and the implied level of GDP from the Atlanta Fed’s GDPNow nowcast (10/14/2022).
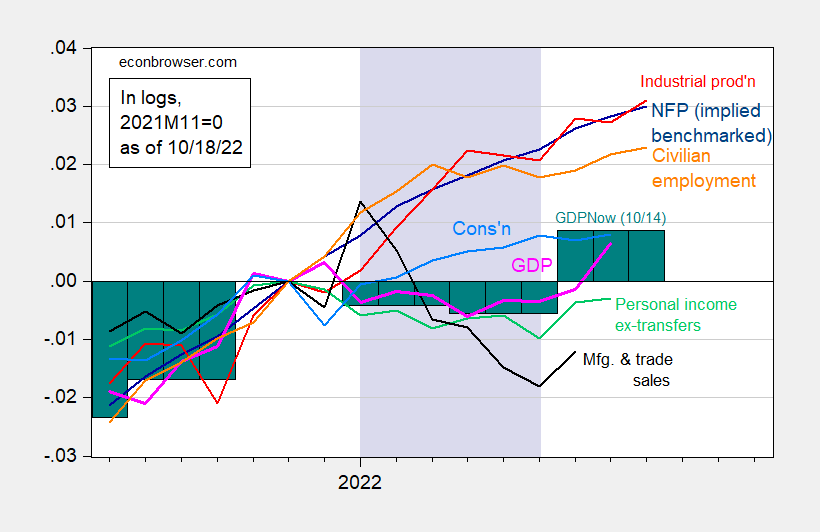
Figure 2: Nonfarm payroll employment as implied by annual benchmark revisions (dark blue), civilian employment (orange), industrial production (red), personal income excluding transfers in Ch.2012$ (green), manufacturing and trade sales in Ch.2012$ (black), consumption in Ch.2012$ (light blue), and monthly GDP in Ch.2012$ (pink), official GDP through Q2, and GDPNow for Q3 (teal bars), all log normalized to 2021M11=0. Lilac shading denotes dates associated with a hypothetical recession in H1. Source: BLS, Federal Reserve, BEA, via FRED, IHS Markit (nee Macroeconomic Advisers) (10/4/2022 release), GDPNow (10/14/22 release), and author’s calculations.
Note the continued growth in the labor series even during the slowdown in official GDP during H1, which some observers have tagged as a recessionary period. Consumption and industrial production also increased (by about 1% and 2% respectively) over this period. Hence, I remain skeptical of the comments that we were in a recession in 2022H1.
Of course, this is a backward looking assessment. A high frequency assessment is here (albeit looking at y/y growth to last week). Looking forward, lots of economists see a recession.
Bruce Hall has once again turned to his drill baby drill nonsense putting up statements from unnamed sources to bolster his BS. Now we know his unnamed sources are often right wing liars but on occasion he does bother to offer up something a credible source allegedly said. But we also knows how he misrepresents what credible people have said – which is why Brucie so rarely links to his sources.
Of course Brucie wants us to believe gasoline prices are over $5 a gallon nationwide. Let me link to this:
https://www.msn.com/en-us/money/markets/gas-prices-fall-for-7-days-as-white-house-considers-selling-emergency-reserves-to-avoid-dreaded-return-to-4-mark/ar-AA136qkY?ocid=msedgdhp&pc=U531&cvid=d2ee3e6aba6449a4b6ae7211282c895b
The Biden Administration is planning to tap into the country’s emergency petroleum reserves in an attempt to cut gas costs ahead of the midterm elections next month, sources told Reuters, even as national gas prices drop for seven straight days as demand drops and several key refineries come back online.
Oh my those socialist Biden policies are hurting Big Oil’s profits. Yea – that is the next line Kelly Anne emails Brucie!
Biden is being helped by the apparent end of the refinery problems on the West Coast, which played the major role in the most recent runup in gasoline prices, especially noticeable in the West, now come to an end apparentlly.
U.S. ten-year yields are above 4% this week, reflecting an increase in rate hike expectations. Mortgage spreads, which had stabilzed briefly after a jump in the 4th week of September, look to be widening again. Rising Treasury and fed funds rates don’t just raise the opportunity cost of holding mortgage securities. They also increase the risk of default, and the increase in risk is probably not linear relative to the rise Treasury yields.
Small wonder, then, that the Home Builders’ confidence index continues to slide. A 50 reading is neutral, and October came in at 38, from 46 in September. The confidence index generally leads recessions and 38 is a strong hint of coming recession. The buyer traffic index, which leads the headline confidence index, was even worse at 25.
The possibility that rapid rate hikes would damage housing demand was clear from the outset. Housing price multiples were crazy against income but mortgage payments were not, prior to rate hikes. There is now a large payment wedge between existing mortgages and new ones. Bill at Calculated Risk puts the year-over-year increase in mortgage payments (P+I) on a given mortgage amount at a record 59%:
https://calculatedrisk.substack.com/p/monthly-mortgage-payments-up-record
The next largest increase in mortgage payments, in 1980, was followed by the worst U.S. housing market performance (in terms of resdential investment as a share of GDP) of any period other than the Great Recession.
Bill is kind enough to point out that Fed rate cuts tend to produce a housing recovery.
Bill McBride also is kind enough to point to other measures of the mortgage rate besides MND:
On Friday, the average 30-year mortgage rate hit 6.7% for zero points and top tier scenarios according to MortgageNewsDaily. This was the highest rate in 20 years. Here is a graph showing the 30-year rate using Freddie Mac PMMS, and MND for last week.
Now Princeton Steve flip flops between the different measures but never tells us which one he is using. And of course his troll BFF JohnH for doing so. Go figure.
Yes nominal rates on 10-year government bonds have risen considerably since August 1. But note the expected inflation component is still only 2.4%. The dramatic rise in real rates may turn out to be a FED mistake.
30 Year Fixed Mortgage Rates
This page provides average 30 year fixed mortgage rates from several different surveys including Mortgage News Daily (daily index), Freddie Mac (weekly survey), Mortgage Bankers Association (weekly survey) and FHFA (monthly survey).
This graph provided by the folks at MND allows one to compare their quotes to those of Freddie Mac. The former tends to be higher than the latter. One should not be surprised as they are measuring different things.
Of course judging from the uninformed and often unnecessarily angry rants from JohnH and Princeton Steve, I suspect neither one of these Know Nothings even realize they are measuring different things.
That all looks surprisingly good. Let’s hope that Boston University doesn’t have a Wuhan problem. Of course, that would end the debate about a possible recession.
https://marginalrevolution.com/marginalrevolution/2022/10/irresponsible-gain-of-function-research.html?
But just in case, pgl should get his 10th booster right now.
OK – anyone who claims Rand Paul is right has to be dismissed out of hand. Now your little jab at me is your usual way of proving what a pathetic little boy you really are. And yes – I did get this vaccine last week. Now I hope you are keeping up with your bleach regime. MAGA!