Answer: Not much. This point is critical in assessing how appropriate conditional forecasts of inflation were, especially those pertaining to 2022.
Textual analysis and market indicators. First up, the Geopolitical Risk Indicator and Economic Policy Index:
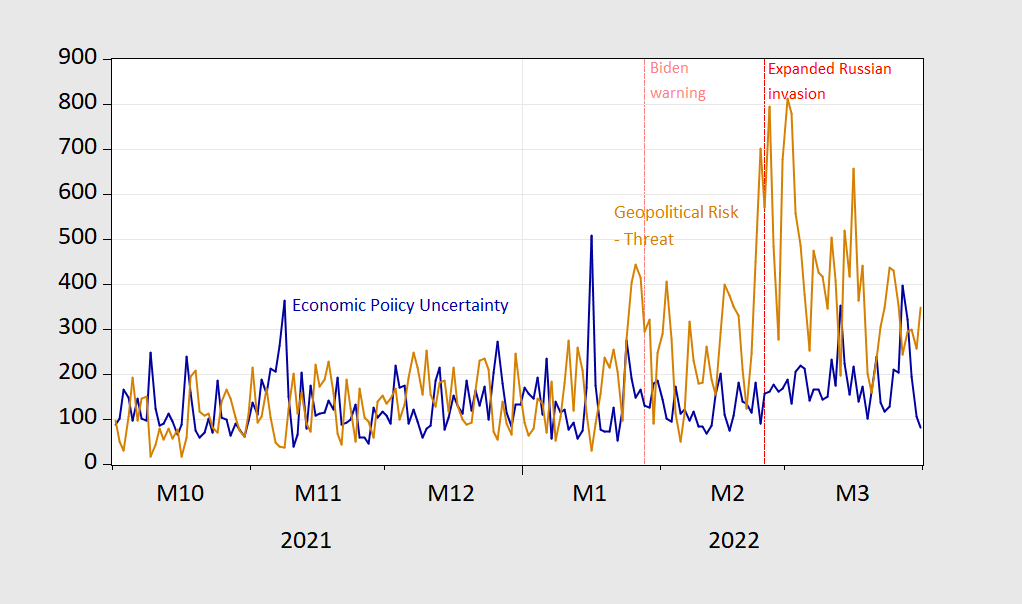
Figure 1: US Economic Policy Uncertainty (EPU) index (blue), and Geopolitical Risk (GPR) index (tan). Source: Baker, Bloom and Davis via FRED, and GPR index, accessed 18 Oct 2022.
Notice that the US EPU — focused on the the US of course, does not indicate much movement before the Biden warning to European leaders, nor just before the Russian “special military operation”. The GPR index did rise as news of US intelligence warnings to Western intelligence agencies circulated, and spiked just days before the actual invasion.
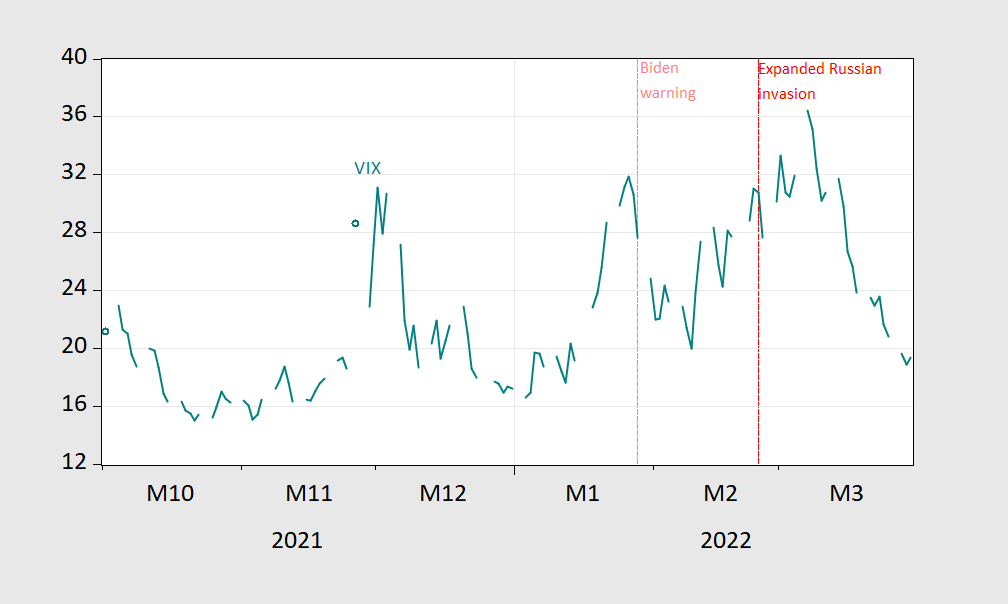
What about market indicators. The VIX spiked at the beginning of December when stock prices dropped, and spiked (as US intelligence warnings circulated). But through the Fall of 2021, the US financial markets did not perceive a high risk of Russian aggression affecting equity markets.
Figure 2: VIX close (teal). Source: CBOE via FRED.
We know that any Russian aggression would’ve had a positive impact on energy prices, both oil and natural gas. Did spot markets (remember, as a storable commodity, oil and natural gas should reflect both current and expected future conditions) reflect anticipated Russian action?
Here’re Brent and Dutch TTF (natural gas):
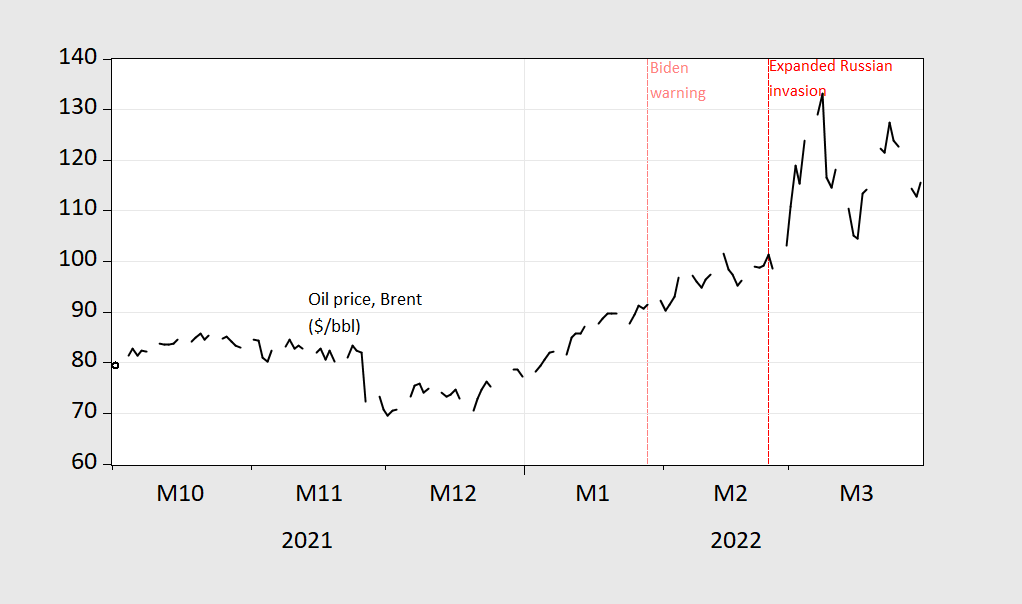
Figure 3: Price of oil (Brent), $/bbl (black). Source: EIA via FRED.
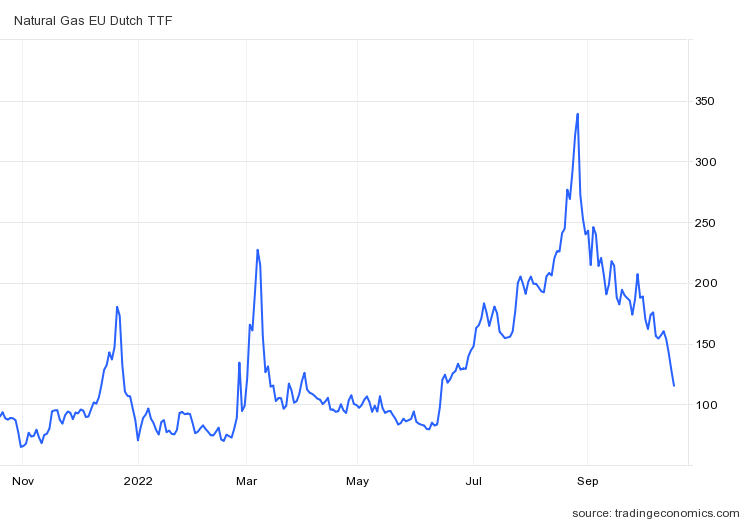
Figure 4: Natural gas EU (Dutch TTF), Eur/MWh (blue), October 2021-October 2022 [NOTE different time scale]. Source: Tradingeconomics.com, accessed 18 Oct 2022.
While there are spikes in both prices, note that until the beginning of the Special Military Operation, prices had stabilized in the EU market for natural gas.
Oil prices as of November were rising, but futures prices indicated backwardation.
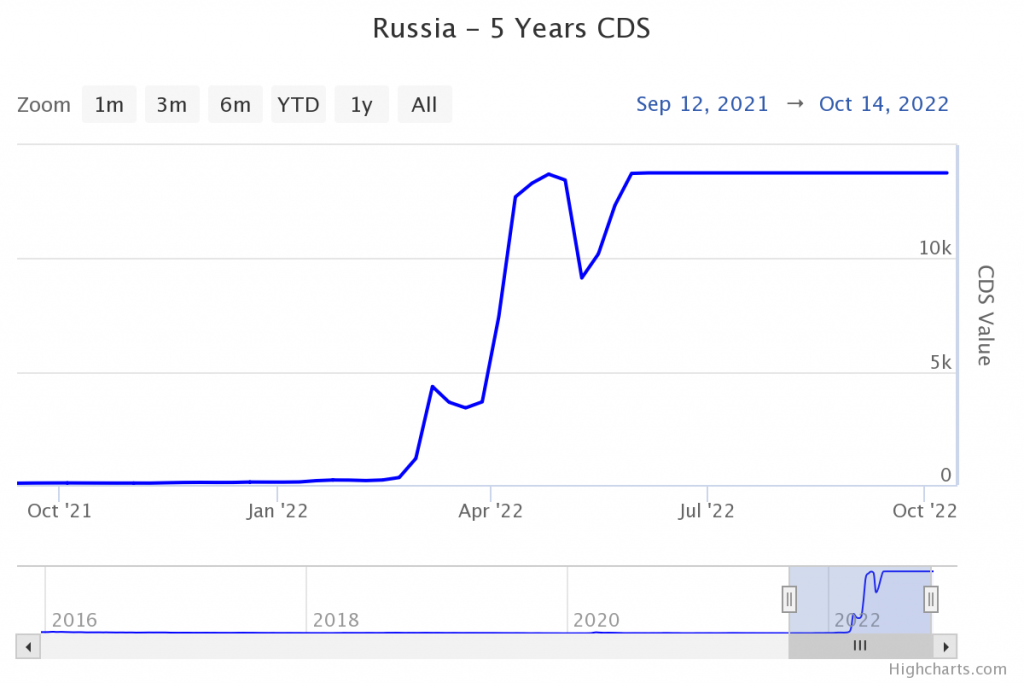
Finally, assuming an expansion of the Russian war on Ukraine was going to spur sanctions, heightening risks of sovereign default, we would have expected a rise in CDS’s value ahead of time. The value did not rise until the initiation of the Special Military Operation.
Figure 5: Russian sovereign debt CDS value. Source: World of Government Bonds, accessed 18 October 2022.
The current value iimplies 100% probability of default using 40% recovery rate.
Without knowing what the prices would’ve been in the counterfactual of no Russian Special Military Operation, one can’t infer the probabilities the markets were assigning to the outcome that was actually realized. However, a high likelihood does not seem to be associated by markets (similarly by textual analysis).
If one believes inflation outcomes are substantially dictated by the trajectory of energy prices, then the forecasts of inflation have to be judged on whether agents believed an expanded Russian invasion was likely. Had forecasters, including those in policymaking arenas, attributed a higher likelihood of enhanced Russian aggression, then inflation forecasts would have likely have been higher (and growth forecasts correspondingly lower).
In other words, keep the distinction between conditional and unconditional forecasts in mind, when assessing the inflation forecasting record.
OK… now let’s talk about Taiwan.
w
Why? US intel is not forecasting an imminent invasion. US intel was forecasting the Russian invasion quite some time before it happened.
Regarding all this, it should be kept in mind that in spite of the accurate forecast coming out of US intel, the Ukrainians were publicly and privately forecasting that the Russians were bluffing and would not invade, having done that previously.
It is also the case that US intel has had a past record of making public claims about other nations that proved not to be true, such as cliaiming there WMDs in Iraq. US intel was right on the invasion this time, but even this time they were wrong on how well the Ukrainians would be able to defend themselves against it and were telling President Zelenskyy to leave Kyiv and also moved the US embassy out of Kyiv, something I said here we should not do.
Despite Russia’s invasion of Ukraine and Saudi Arabia’s decision in output cut, it’s all Biden’s fault. Our troll choir insists Biden has declare war on oil which has led to a lack of supply. That’s a funny story, given that output has been rising steadily since the Covid-recession low:
https://www.eia.gov/dnav/pet/hist/LeafHandler.ashx?n=pet&s=mcrfpus2&f=m
Biden has announced a further SPR release, clearly an effort to prevent the consumption of petroleum. ‘Cause the war on oil.
Some people will say anything.
“given that output has been rising steadily since the Covid-recession low”
Nice chart but please tell me that Bruce Hall never lies to us (snicker). US oil production was rising from late 2016 to the end of 2019 but then boom – the total incompetence of Trump in handling COVID brought a huge drop. Of course this is all related to changes in the demand for oil and not the supply side BS from Bruce Hall.
Bruce Hall’s exact words:
Biden’s ideological fits about the fossil fuel industry, starting day 1 in office, have cause a significant reluctance of oil companies and investors to spend more money on exploration and new refinery capabilities. US field oil peaked at 13.0 million bpd during Trump’s administration after three years of strong growth because COVID and the shutdown hysteria of 2020 brought the economy to its knees. After seven quarters under the Biden Administration, that number is 11.8 bpd with very little growth since April 2022.
Well at least Brucie got the fact that it was Trump who presided over the 2020 collapse even if this troll said there was “shutdown hysteria”. No Brucie – there was Trumpian incompetence. And Macroduck’s link clearly shows oil production has risen since Biden took office. So Brucie – you need to improve on your lying skills.
If we take this link back several decades, we notice that US oil production fell a lot from 1970 to 2010 but under Obama production soared. Gee Brucie never told us that. BTW oil production has risen since April 2022. Bruce said it had not but then we know he lies A LOT.
prices in food rents, services, etc. driving gasoline demand/prices,
national crude stocks amount reduced by nearly the accumulated releases; petrol reserve depletion matched by comm’l stock keeping roughly level.
petroleum product exports up since the ukraine escallation
https://www.eia.gov/dnav/pet/hist/LeafHandler.ashx?n=pet&s=wrpntus2&f=4
spr release may effect wti/nymex future, gasoline prices more complex.
Understanding markets requires one to look at both production and prices – something Bruce Hall never got. You provided US production, FRED shows prices.
Yes US oil production was high before COVID but so where market prices. If Bruce thinks this proves Trump bolstered supply, I guess he never learned the basic demand = supply model. Now COVID lend to a temporary inward shift in demand as oil prices declined.
Now I know self centered as it gets Bruce Hall is mad he has to pay more for gasoline but as Macroduck notes, US oil production has risen since 2000. Most economists would see this as an outward shift in the demand curve. To suggest as Brucie routinely does there has been some inward shift in the supply curve is as dumb as it gets.
Now it is true that US oil production has risen only a small amount this year Bruce Hall forgets to tell us that the market price started falling. But to be honest and smart about this issue is not something Kelly Anne Conway can have Brucie do. No he has to blame Biden for something even as Brucie has never had an effing clue what the facts are.
https://www.msn.com/en-us/news/world/putin-is-using-elon-musk-to-signal-terms-for-ending-ukraine-war-russia-expert/ar-AA1364UM
Russian President Vladimir Putin is using billionaire Elon Musk to broadcast terms for ending his war in Ukraine, former top National Security Council analyst Fiona Hill said. Hill told Politico in an interview published Monday that Putin has chosen Musk in a well-worn playbook of using prominent businesspeople to communicate his demands to a wider audience. “Putin plays the egos of big men, gives them a sense that they can play a role. But in reality, they’re just direct transmitters of messages from Vladimir Putin,” Hill told Politico. Musk, the CEO of Tesla and SpaceX, earlier this month shared suggestions for ending the war with his followers on Twitter, earning the condemnation of Ukrainian officials. His proposal included redoing “elections” in the four Ukraine regions Putin annexed “under U.N. supervision,” referring to the sham referendums the Kremlin organized in these regions. Musk also suggested formally declaring Crimea, which Putin illegally annexed in 2014, part of Russia.
WTF does Musk think he is? Supporting Putin strikes me as treason.
treason, if there were any reason for us support as in advise and consent from the senate…..
fionna hiull mind reading again!
putin has attacked about a third of the Ukrainian power stations in recent days. it is an attempt to damage the civilian population into the upcoming winter. he is also attacking public water works. putin will be tried for war crimes. and hung for the world to see what a decrepit and morally repugnant sociopath he is. I have a love for the Russian people. but this unprovoked war is making them a pariah nation.
If you used the weekly numbers for Brent instead of dailies, your graph would be less choppy and the visual interpretation easier.
For WTI futures: https://www.eia.gov/dnav/pet/hist/LeafHandler.ashx?n=PET&s=RCLC1&f=W
For Brent spot: https://www.eia.gov/dnav/pet/pet_pri_spt_s1_w.htm
i you are interested in event impact, then shorter duration is better. you don’t want to average out the events.
In fact, both the weekly EIA PSR and the monthly STEO both show US onshore lower 48 crude and condensate production stagnating since about June. The has been accompanied by a plateauing of rig and spread counts, with the former materially no higher than April and the latter no higher than February. To a certain extent, this is contradicted by the EIA DPR, which shows a rise of 182 kbpd from key shale plays for the month of September. Still, August and July production were revised down 125-150 kbpd, a trend we’ve been seeing recently. That is, a given reported level of production for a month is revised away the next month. So what to believe?
Through the Sept STEO, that is, through the 12th of the month, US crude and condensate production is essentially flat since late last year, and this despite WTI averaging nearly $95 / barrel since last October.
Meanwhile, operators continue to run down DUC inventories. Drilling and completion activity has become materially divorced from oil prices. This is the first time we’ve seen this behavior since the start of the shale revolution.
The numbers say the shale revolution is over. It is this which has passed the initiative back to OPEC+. And that’s a problem.
In May through August, there were reports in the financial press citing research from several sources (Deloitte, Rystad, S&P…) about the chance that the debt piled up by the fracking industry could be retired by early 2024 if prices remain steady and discipline is maintained. May through August was the peak for prices, but press reports were not clear about what price level was needed to clear debts. Maybe current prices are enough. Howver, “maintaining discipline” pretty clearly meant “don’t binge on investment the way you did before” which is one reason investment has been slack. Been there, squandered that.
There is also the issues of rising borrowing costs and rising recession fear. And depletion.
This fracking business is among the shorter-lived big deals of our generation. I can remember a pretty well informed commodity friend calling me up and saying she wanted to buy natural gas futures based on charts – “putting in a bottom” and all that. My answer was “have you heard about this fracking stuff?” It really wasn’t that long ago. And it really hasn’t made much of a return for investors.
i have a cousin who signed away gas rights to fracking on her property over a decade ago. they got a lump sum of money, and for a few years some royalties. it was enough to put their two kids through college, but they thought it would also be a retirement fund. the monthly payouts are now very low. they live on a farm in the countryside. they now have contaminants in their water well. no city water to replace it. it is difficult to live in the country with a contaminated water supply on a farm. the kids would have received grants for college, had the pot of cash not been available. hard to see how fracking improved their life in the long term.
there’s a couple problems with equating quoted energy prices with profit potential for oil & gas E&Ps….one that applies specifically to oil is backwardation; today’s WTI quote of $86 is for oil delivered in November 22; November 2023 oil was last at $75.88….that spread has been much wider; close to $20 YoY….the point is that if you frack a well today, prices you can contract for will be much less than what’s quoted today over the life of production…
the other problem is that most E&P companies hedge, locking in prices they need to profit years before drilling, which are hence lower than today’s prices….some are also enticed into complicated hedging strategies that i’d bet they don’t understand….about half of US natural gas producers lost money as natural gas prices doubled last year, because with the combination of derivatives they owned, they lost more every time the price rose..
WTI has fallen back down to barely above $83 per barrel, despite the OPEC+ announced cutback.
You are correct. Now Princeton Steve has decided to confuse this discussion with:
“US crude and condensate production is essentially flat since late last year, and this despite WTI averaging nearly $95 / barrel since last October.”
I would challenge this notion that production is “flat” and it is certainly not the case that oil prices have been consistently high.
here is weekly US crude production, in thousands of barrels per day, since 1983:
https://www.eia.gov/dnav/pet/hist/LeafHandler.ashx?n=PET&s=WCRFPUS2&f=W
it’s not been flat like a lake on a windless night, but it’s been a couple hundred thousand barrels per day on either side of 12 million per day since April Fools Day…
and that 12 million barrels per day is still 8.4% below that of our pre-pandemic production peak of 13,100,000 barrels per day, but 23.7% above the pandemic low of 9,700,000 barrels per day that US oil production had fallen to during the third week of February of 2021…
that flat US oil production also brings to mind the US jawboning at OPEC to increase theirs….it just so happens i have a recent table of OPEC production, not weekly, but monthly, quarterly & back a couple years to compare it to…i’ll let you all be the judge as to who the slackers are:
https://blogger.googleusercontent.com/img/b/R29vZ2xl/AVvXsEhR0hEF5l0KFYorVSr3SU0dv3UgSWS7japfhwsl6hXHm5Z0KmIyYwQYT54VFz097ZoaPqKDdGGPYneqWPGRqYGugr7kmMuXsq99n7kBalGc6PpySJ0bqPXYpQP_AIdTXHaH_CeaUzukdDyUDL1cbxvCqZ06Ls_EYO3n6D8ifbr5DkcID1e1az5r_WB2/s1126/September%202022%20OPEC%20crude%20output%20via%20secondary%20sources.jpg
the “secondary sources” those OPEC production totals are sourced from are the International Energy Agency (IEA), the oil-pricing agencies Platts and Argus, the U.S. Energy Information Administration (EIA), the oil consultancy Cambridge Energy Research Associates (CERA) and the industry newsletter Petroleum Intelligence Weekly, and as of the June report, the consultancy Wood Mackenzie and the research and intelligence firm Rystad Energy…
since Europe can’t import Russian gas over a few hundred miles of pipeline, it’s now being liquefied in Russia, sent by tanker to China, who then turns around and sells it to Europe…much more expensive, + massive greenhouse gas emissions on every step of the journey…
just as crazy, New England utilities are importing liquidized natural gas by tanker from Qatar because there are no pipelines from PA and they aren’t allowed to import LNG from Russia anymore…
rjs,
Just what in this is the “crazy” part? That there are no pipelines from PA? That Putin invaded Ukraine leading to a banning of LNG from Russia? Buying from Qatar as an alternative? You seem to be rather worked up about what looks like a sideshow to a much bigger story. Or maybe you live in New England and just are not looking forward to higher heating bills and calling it “craxy” out of personal annoyance.
yep, i was just calling it “crazy” out of personal annoyance…the first story i posted had aggravated me, & i carried that bad attitude into describing the second story..
“New England utilities are importing liquidized natural gas by tanker from Qatar”
no, they are not. they are shipping lng from the us gulf coast. the problem is one major producer, the lng Freeport plant, exploded this summer and may not yet be back online. until it returns to service, lng prices will remain elevated. on the other hand, since we cannot export the lng, the result is domestic supply of natural gas is high and prices continue to be driven down domestically.
shipping LNG from the Gulf Coast to New England would certainly make more sense than shipping it from Russia or Qatar…but as far as i know, there are no US flagged LNG tankers, and i’ve heard no news about a Jones Act waiver for that kind of transport…..a diesel fuel tanker sat off Puerto Rico with parts of the island in the dark over a week before it was waived in, & then only after threatening to leave….Biden is committed to protecting union jobs, even if they don’t exist in terms of LNG…
i’m also pretty sure that most US LNG cargoes are already under long term (20 year) contracts, mostly with China, so if New England wanted to buy US Gulf Coast LNG, they’d probably have to pay China’s asking price…
“i’m also pretty sure that most US LNG cargoes are already under long term (20 year) contracts, mostly with China, so if New England wanted to buy US Gulf Coast LNG, they’d probably have to pay China’s asking price…”
that is a pretty big assertion you are making. it would help if you could show some proof.
earlier this week, the jones act was waived for Puerto Rico for liquified natural gas
https://thehill.com/homenews/3692392-puerto-rico-gets-jones-act-waiver-for-liquified-natural-gas-shiptments/
so there is precedence for such an action. until the lng Freeport plant is back online, that port cannot export lng anyways. so we have limited export capacity today. perhaps when it is back on, they will issue a jones act waiver. anybody against that is probably playing politics. I don’t think we will see lng imports to New England unless things get very bad, though. higher prices are probably not enough. no fuel would be a different story, I imagine.
re: “i’m also pretty sure that most US LNG cargoes are already under long term (20 year) contracts, mostly with China, so if New England wanted to buy US Gulf Coast LNG, they’d probably have to pay China’s asking price…”
that is a pretty big assertion you are making. it would help if you could show some proof.
that has been in the news all year, with the Europeans sometimes paying up to ten times what the US price has been…
Bloomberg in March: https://www.bloomberg.com/news/articles/2022-03-15/china-sells-some-spare-u-s-gas-to-europe-for-a-hefty-profit
WSJ a few weeks ago: https://www.wsj.com/articles/china-is-rerouting-u-s-liquefied-natural-gas-to-europe-at-a-big-profit-11664772384
liquefaction facilities cost billions of dollars and take years to build….FIDs aren’t usually made until a good part of the expected product is sold. Chinese companies have been the biggest buyers…. there’s currently 7 publicly traded US LNG exporters operating; dig out their prospectuses and you’ll see what i mean…