Looking at not seasonally adjusted and seasonally adjusted private employment from CES vs. QCEW and ADP.
Looking at unadjusted data, CES data is 637 thousand above QCEW for June 2022; and is 837 thousand above ADP for November 2022.
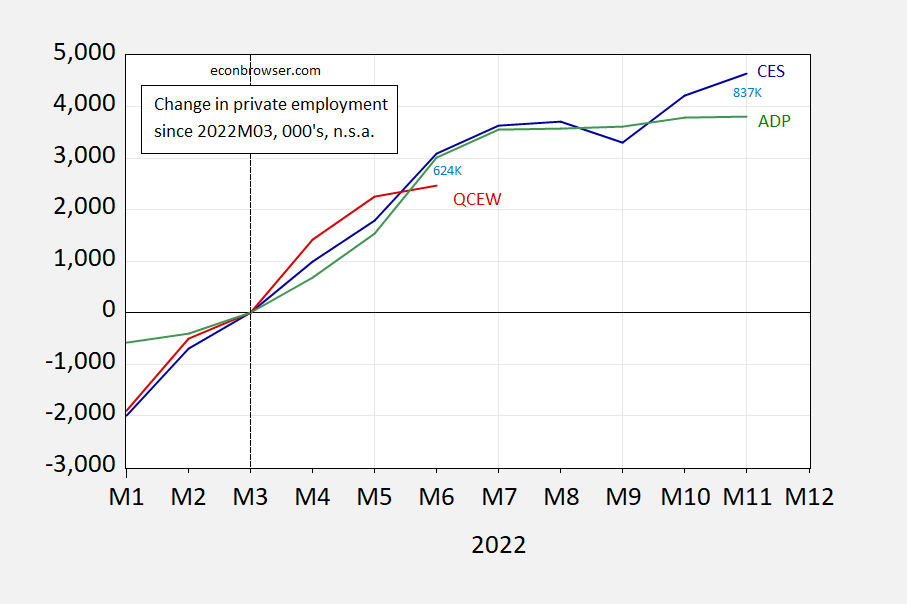
Figure 1: Change in private nonfarm payroll employment (blue), and private QCEW covered employment in US (red), and ADP private nonfarm payroll employment (green), all not seasonally adjusted, all in 000’s, relative to 2022M03=0. Source: BLS, BLS and ADP via FRED and athor’s calculations.
In percentage terms, the gaps are pretty small; the CES series is 0.6 ppts above QCEW in June, and 0.5 ppts in November.
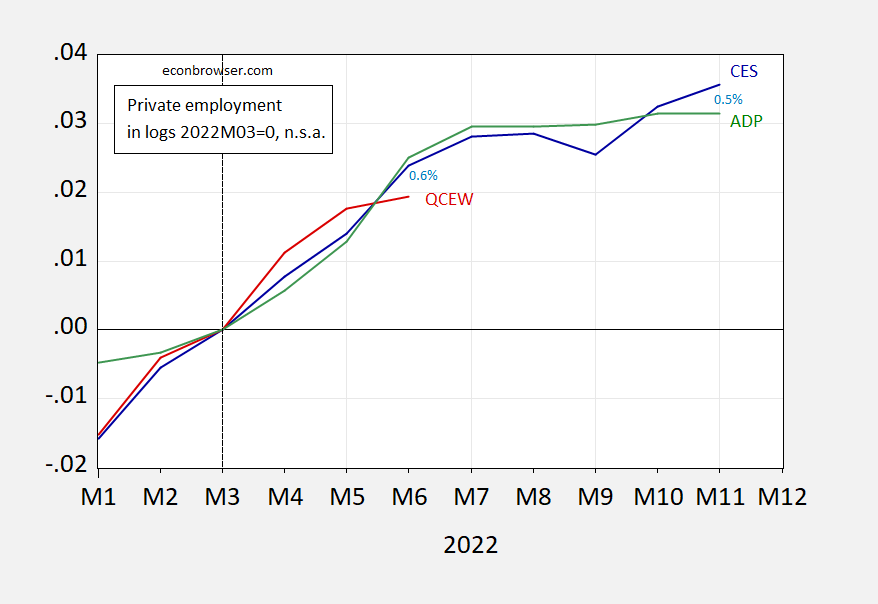
Figure 2: Private nonfarm payroll employment (blue), private QCEW covered employment in US (red), and ADP private nonfarm payroll employment not seasonally adjusted, all in logs, 2022M03=0. Source: BLS, BLS and ADP via FRED, and athor’s calculations.
Finally, for seasonally adjusted data, we have the following picture:
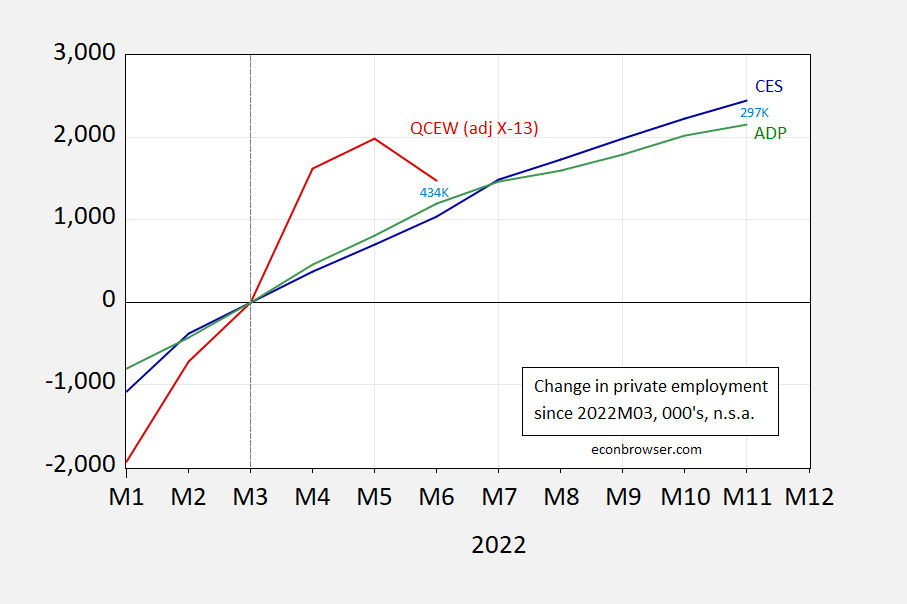
Figure 3: Change in private nonfarm payroll employment (blue), and private QCEW covered employment in US (red), and ADP private nonfarm payroll employment, all in 000’s, relative to 2022M03=0. QCEW adjusted by author using log transformation, Census transformation X-13 and X-11 seasonal adjustment. Source: BLS, BLS and ADP via FREDand athor’s calculations.
As of June, the CES series is 433 thousand below the QCEW series, while the CES series is above the ADP series by 297 thousand in November 2022. Admittedly, however, the QCEW figure is sensitive to how seasonal adjustment is applied (Census X13/seasonal adjustment X-11 vs. moving geometric average).
Being in the back bench for this topic, I found the following helpful to follow the discussion.
https://www.bls.gov/web/empsit/cesfaq.htm
The CES and Quarterly Census of Employment and Wages (QCEW) programs are related but do not report the exact same information at the same frequency. The QCEW program publishes a quarterly count of employment and wages covering 97 percent of U.S. jobs, available at the county, Metropolitan Statistical Area (MSA), State, and National levels by industry. The CES program surveys about 131,000 businesses and government agencies, representing approximately 670,000 worksites, in order to provide detailed industry data on employment, hours, and earnings of workers on nonfarm payrolls on a monthly basis.
Unemployment Insurance (UI) tax reports, submitted by nearly all businesses in the U.S., are used as both the input data for QCEW data and as the majority of the sample frame for the CES survey and cover almost all private industries and government agencies. CES employment figures are benchmarked each year in large part using data from the QCEW program because both programs use the pay period including the 12th of the month as the reference period for employment.
QCEW quarterly wages include total compensation paid during the calendar quarter to all workers; CES hours and earnings data are reported for all employees and for production or nonsupervisory employees in private industry who received pay (whether they worked or not) during any part of the pay period that includes the 12th day of the month. CES earnings do not include irregular bonuses or retroactive pay.
CES data are published 3 weeks after the week that includes the 12th of the month, typically the first Friday of the following month. QCEW data are published much later, approximately 6 months after the end of the reference period.
More information about the differences between the QCEW, CES, and other establishment-based employment measures is available at http://www.bls.gov/news.release/cewqtr.tn.htm. For additional information about the QCEW survey visit http://www.bls.gov/cew/overview.htm.
I have gone back and crunched the numbers for Q2 job growth (or losses) in the QCEW since the beginning of the database in 2001. In the below chart, the first line is the year, the 2nd is the non-seasonally adjusted number of jobs added in Q2 in the QCEW, in millions, and the 3rd is the non-seasonally adjusted Establishment survey number:
https://data.bls.gov/pdq/SurveyOutputServlet
Year QCEW PAYEMS
2001 2.0* 1.62
2002 2.5 1.79
2003 2.4 1.74
2004 2.9 2.76
2005 3.0 2.81
2006 2.9 2.58
2007 2.7 2.43
2008 1.9* 1.55
2009 0.7* 0.14
2010 3.1 2.61
2011 2.7 2.71
2012 2.7 2.46
2013 2.8 2.61
2014 3.2 2.83
2015 3.2 2.75
2016 2.7 2.62
2017 2.9 2.58
2018 2.9 2.70
2019 2.6 2.44
2020 -12.0* -16.3
2021 3.6 3.25**
2022 2.1 2.91
*=lower than Q2 2022 QCEW
**=higher than Q2 2022 CES
I then went back and compared with the seasonally adjusted Q2 numbers in the CES. Every year that the NSA QCEW numbers for Q2 were below 2.0 showed actual job losses in the seasonally adjusted CES. The three years with the next higher numbers compared with Q2 2022 – 2007, 2012, and 2019 – generated seasonally adjusted CES job gains of 90,000/month, 85,000, and 165,000.
It looks like the Philadelphia Fed ran a regression of the two columns through 2021, then plugged in the 2022 QCEW number to generate a CES non-seasonally adjusted result, and then further plugged in the CES seasonal adjustment. It might be worthwhile if our gracious host were interested in generating this regression line.
In any event at this point it very much looks like the Philadelphia Fed’s paper has a lot of merit: the NSA QCEW data shows a very serious slowdown in job growth in Q2. And since the QCEW isn’t a survey sample, but rather collects about 95% of the entire data, it needs to be taken seriously (with the caveat that it is preliminary data).
It’s also in accord with the Household survey, which shows only 12,000 jobs added since March, and payroll tax collections by the US Treasury, which show a sharp slowdown that is first apparent in June’s +0.5% YoY growth.
The problem is the data is pandemic corrupted. Probably it showed a overshoot over “actual” transmitted data, but more real as the economy surged from the lockdowns. It means the government is adding back in missing data in a mean trimmed way. Its why I say the recession “already happened” but was papered over. Now I expect Household and QCEW data to start growing again.
https://www.msn.com/en-us/tv/news/donald-trump-s-nft-collection-crashes-over-50-after-12-hour-selloff-frenzy/ar-AA15qWot?ocid=msedgdhp&pc=U531&cvid=a7b94163879a47e381800e05f9e7896e
The Trump Digital Trading Cards project has been incredibly volatile over the past day. The floor price peaked at around 0.84 ETH ($1,182) on Saturday, only to plunge as low as 0.33 ETH ($390) by early Sunday morning– representing a significant decrease in value.
The Trump Digital Trading Cards project may be more of a loser than investing in crypto!
Ole Bark, bark, only a Trump obsessed liberal would expect the Trump Digital Trading Cards to be an investment. BTW, how much in total have you so far lost? In crypto? In Trump Digital Trading Cards?
Ah CoRev – I have neither bought these stupid trading cards nor a single bit of crypto. I’ll leave being stupid to the experts like you.
CR, who but a Trump obsessed doofus, would shell out $99 for Trump “cards”? Honus Wagner, he isn’t.
Noneconomist,
Of course Honus Wagner cards are worth far more than $99. Baseball cards are up in value right now, with the most valuable ones in the millions of dollars now. Try a mint condition rookie Mickey Mantle, but I am not even sure there are any Honus Wagners in mint condition.
Of course for the NFTs, they are all effectively in “mint condition,” hah hah.
https://www.mediaite.com/print/kevin-mccarthys-gop-mentor-scolds-him-in-scathing-comments-to-the-new-yorker-he-lies-hell-change-the-lie-if-necessary/
Rep. Kevin McCarthy’s (R-CA) mentor scolded the House GOP leader in comments to the New Yorker in a report on McCarthy’s ongoing effort to secure the position of speaker of the House next year under a new slim GOP majority. Former Rep. Bill Thomas (R-CA) spoke with reporter Jonathan Blitzer about his former “protege,” describing him as a liar. Thomas previously offered a blunt and negative assessment of McCarthy after the January 6 Capitol riot, blasting him for his relationship to Donald Trump. The two Republicans worked together for over a decade, with McCarthy getting his start under Thomas. “The Kevin McCarthy who is now, at this time, in the House isn’t the Kevin McCarthy I worked with,” Thomas, 81, offered in an even more scathing review of his former colleague.
Thomas described McCarthy as a chameleon willing to lie to get what he wants. “Kevin basically is whatever you want him to be. He lies. He’ll change the lie if necessary. How can anyone trust his word?” the Republican said.
Huh? McCarthy is ony doing what our trolls here (Princeton Steve, JohnH, Bruce Hall, and CoRev) routinely do. So what’s the problem?
One learns a lot of strange things if one enters into the weird world of Marjorie Taylor Greene. But what’s up with her war on Wal-Mart?
https://www.msn.com/en-us/lifestyle/lifestyle-buzz/marjorie-taylor-greene-accuses-perverted-walmart-of-grooming-kids/ar-AA15rWWh
Rep. Marjorie Taylor Greene (R-GA) has ramped up her war against Walmart selling sex toys. On Saturday, she posted a photo claiming to show sex toys on sale at a Walmart in Georgia. They appear to be on sale next to children’s toothbrushes. “@Walmart many of your customers in my district are reaching out to me about sex toys being sold in your Dalton store,” Greene tweeted. “They’re extremely upset and absolutely horrified that sex toys are being sold openly right next to children’s toothbrushes! This is grooming.” She continued in further tweets: “Selling sex toys openly where children are exposed to them is wrong, inappropriate, immoral, indecent, perverted, shameful, and incredibly harmful to children. Why is Walmart participating in the grooming and sexualization of children? Is this in all stores or just Dalton?
There it is – grooming again. But wait – I’m heading out to Wal-Mart later. Attention Wal-Mart shoppers – get your sex toys on aisle 3! ,Of course, be nice to the parents on aisle 2 as they buy their kids a toothbrush.
Oh wait – that does not happen in Manhattan. Now in Dalton, I hear parents are trying to get their middle school daughters married off quickly so you never know.
https://www.nytimes.com/2022/12/19/business/economy/recession-economy-forecast-2023.html
December 19, 2022
Trust the Models? In This Economy?
Years into the pandemic, it is still difficult to get a handle on what comes next for the economy by looking at examples from the past.
By Jeanna Smialek
Historical data has always been critical to those who make economic predictions. But three years into the pandemic, America is suffering through an economic whiplash of sorts — and the past is proving anything but a reliable guide.
Forecasts have been upended repeatedly. The economy’s rebound from the hit it incurred at the onset of the coronavirus was faster and stronger than expected. Shortages of goods then collided with strong demand to fuel a burst in inflation, one that has been both more extreme and more stubborn than anticipated.
Now, after a year in which the Federal Reserve raised interest rates at the fastest pace since the 1980s to slow growth and bring those rapid price increases back under control, central bankers, Wall Street economists and Biden administration officials are all trying to guess what might lie ahead for the economy in 2023. Will the Fed’s policies spur a recession? Or will the economy gently cool down, taming high inflation in the process?
With typical patterns still out of whack across big parts of the economy — including housing, cars and the labor market — the answer is far from certain, and past experience is almost sure to serve as a poor map.
“I don’t think anyone knows whether we’re going to have a recession or not, and if we do, whether it’s going to be a deep one or not,” Jerome H. Powell, the Fed chair, said during a news conference last week. “It’s not knowable.”
Doubt about what comes next is one reason the Fed is reorienting its monetary policy approach. Officials are now nudging borrowing costs up more gradually, giving them time to see how their policies are affecting the economy and how much more is needed to ensure that inflation returns to a slow and steady pace.
As policymakers try to guess what lies ahead, the markets that have been most disrupted in recent years illustrate how big changes — some spurred by the pandemic, others tied to demographic shifts — continue to ricochet through the economy and make forecasting an exercise in uncertainty….
This reads like “I have a deadline” journalism. Not a single new fact. Not a single fresh idea. Well written, of course, but that’s no reason to quote extensively when you could just provide a link, as you’ve been repeatedly asked to do. Bad manners. Give it a rest.
https://www.nytimes.com/2022/12/18/us/politics/defense-contractors-ukraine-russia.html
December 18, 2022
Military Spending Surges, Creating New Boom for Arms Makers
The combination of the war in Ukraine and concern about longer-term threats from Russia and China are driving a bipartisan push to increase U.S. capacity to produce weapons.
By Eric Lipton, Michael Crowley and John Ismay
WASHINGTON — The prospect of growing military threats from both China and Russia is driving bipartisan support for a surge in Pentagon spending, setting up another potential boom for weapons makers that is likely to extend beyond the war in Ukraine.
Congress is on track in the coming week to give final approval to a national military budget for the current fiscal year that is expected to reach approximately $858 billion — or $45 billion above what President Biden had requested.
If approved at this level, the Pentagon budget will have grown at 4.3 percent per year over the last two years — even after inflation — compared with an average of less than 1 percent a year in real dollars between 2015 and 2021, according to an analysis by Center for Strategic and Budgetary Assessments for The New York Times….
https://apps.bea.gov/iTable/?reqid=19&step=2&isuri=1&categories=survey#eyJhcHBpZCI6MTksInN0ZXBzIjpbMSwyLDNdLCJkYXRhIjpbWyJjYXRlZ29yaWVzIiwiU3VydmV5Il0sWyJOSVBBX1RhYmxlX0xpc3QiLCI1Il1dfQ==
November 30, 2022
Defense spending was 56.4% of federal government consumption and investment in July through September 2022. *
$935.1 / $1,656.9 = 56.4%
Defense spending was 20.8% of all government consumption and investment in July through September 2022.
$935.1 / $4,486.5 = 20.8%
Defense spending was 3.6% of GDP in July through September 2022.
$935.1 / $25,699.0 = 3.6%
* Billions of dollars
This WSJ report is claiming that the Biden White House knows how to profits from the volatile oil market:
https://www.wsj.com/articles/u-s-scores-4-billion-windfall-on-oil-reserve-sales-11671420244?st=7u6pdbx3dshiatw&reflink=desktopwebshare_permalink
Emergency releases from the U.S. Strategic Petroleum Reserve are slated to end this month, concluding an unusual attempt to lower gas prices after Russia’s invasion of Ukraine sent oil prices soaring. Over the release period, Washington sold 180 million barrels of crude at an average of $96.25 apiece, well above the recent market price of $74.29—meaning the U.S., for now, is almost $4 billion ahead.
WSJ, doing a year-end wrap-up, notes that small U.S. investors were net equity buyers this year, contrary to the normal pattern when equities fall sharply.
Two reasons come to mind. One is that gains from recent years mean capital gains tax would be due upon sale. The other is that alternatives were unattractive – bods were falling and money -market rates, while higher now, have clearly been on the way up. Small investors may not like the equity market any better than the big guys. They were stuck looking for an off ramp. Cash is up as a share of equity fund holdings.
Looking at stock performance in recent days, I kinda think selling losers for tax losses is part of the story. Cash in funds and more being accumulated points to stock inflows in early 2023. Small investors never being net sellers points to a limit on equity upside.