With Q1 3rd release, along with GDP+, we have the following picture (in levels):
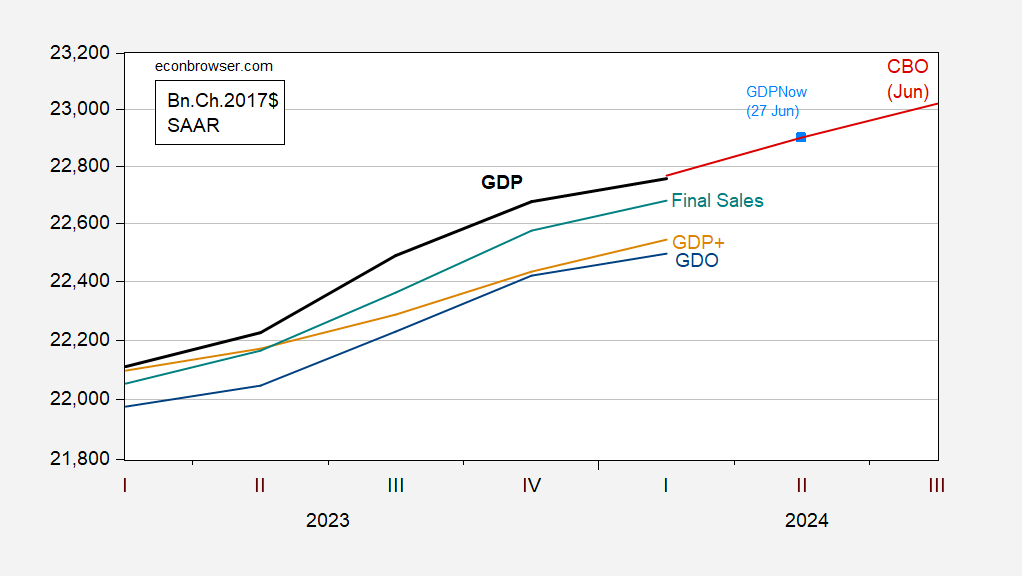
FIgure 1: GDP reported (bold black), GDO (blue), GDP+ (tan), final sales (light blue), CBO June projection (red), and GDPNow (27 June), all in bn.Ch.2017$ SAAR. GDP+ level iterated on 2019Q4 reported level of GDP. Source: BEA 2024Q1 3rd release via FRED, Philadelphia Fed, Atlanta Fed, CBO (June), and author’s calculations.
Reported GDP is substantially above GDO or GDP+ (1.1% and 0.9% respectively), but the growth rates are not too dissimilar. GDPNow is tracking the June CBO projection (based on early May data).
Final sales is a measure of aggregate demand; this measure is maintaining pace.
It’s easier to see some of these trends in growth rates.
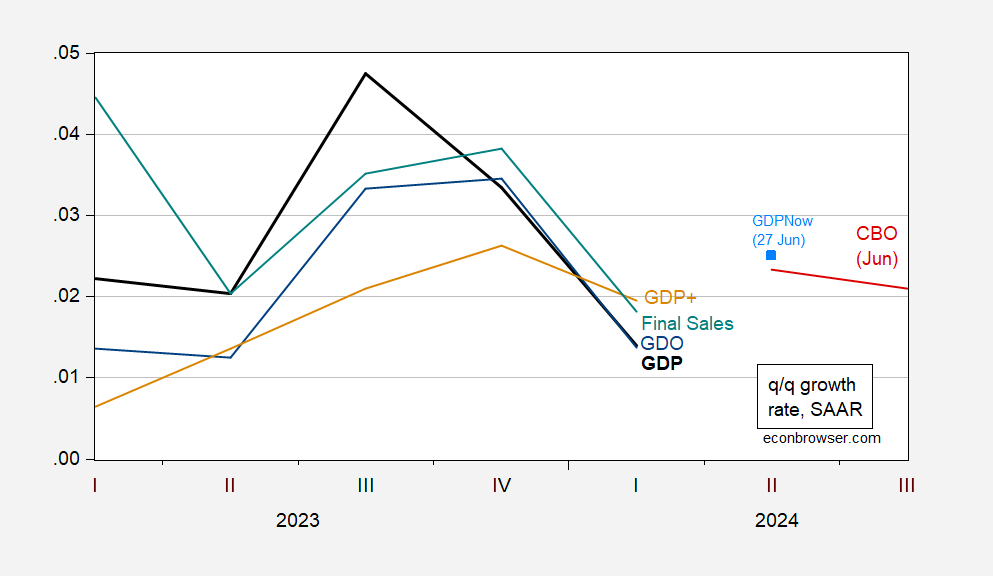
FIgure 2: Quarter-on-Quarter annualized growth rate of GDP reported (bold black), of GDO (blue), of GDP+ (tan), of final sales (light blue), of CBO June GDP projection (red), and of GDPNow (27 June). Growth rates calculated as first log differences. Source: BEA 2024Q1 3rd release via FRED, Philadelphia Fed, Atlanta Fed, CBO (June), and author’s calculations.
What’s also true is that all measures have decelerated in Q1, with GDP and GDO growth rates matching.
At a higher frequency, we have slight acceleration, as the Lewis-Mertens-Stock/NY Fed WEI is reading at 2.53% (for data through 6/22), while the Baumeister/Leiva-Leon/Sims is at -0.16% (i.e., -0.16% below trend growth)
If 2024QII growth is anywhere near 2% (on annualized basis) the economy will remain strong going into the November elections. I guess Putin is going to have to get very busy if he wants to destroy NATO and the American democracy.