Today we are pleased to present a guest contribution written by Virginie Coudert (Banque de France and CEPII), Cécile Couharde (EconomiX-CNRS, University of Paris Nanterre), Carl Grekou (CEPII and EconomiX-CNRS), and Valérie Mignon (EconomiX-CNRS, University of Paris Nanterre, and CEPII). This blog post reflects the opinions of the authors and does not necessarily express the views of the institutions to which they belong.
The 2008 financial crisis and the sovereign crisis that followed in Europe have revived the old debates about the European Monetary Union (EMU). The key question underlying most issues is to know if member states have benefited enough from sharing the same currency and if their differences have begun to be ironed out.
In a recent working paper (Coudert et al., 2019), we revisit this issue by taking stock of the consensus reached after the 2008 turmoil that highlighted the accumulation of macroeconomic imbalances in the run-up to most financial crises. Specifically, we examine between-country disparities in terms of equilibrium exchange rates, i.e., exchange rates that would prevent currency misalignments resulting from unsustainable macroeconomic disequilibria within the member countries. There is common sense among economists and policymakers that currency misalignments—i.e., departures of real exchange rates from their equilibrium levels—are likely to cause substantial losses in economic efficiency and social welfare. As a consequence, minimizing currency misalignments may be a reasonable goal for governments, along with domestic objectives regarding inflation and the output. If the equilibrium exchange rate matters for efficiency and social welfare, it also plays a key role in allowing any economy to reach simultaneously both its internal and external balances. In the context of a monetary union, currency misalignments are especially detrimental because the nominal parity can no longer be adjusted. The only possible adjustment concerns prices. This is particularly painful when one member country has an overvalued real exchange rate, as it has no choice but to reduce its relative prices by cutting spending and limiting wages.
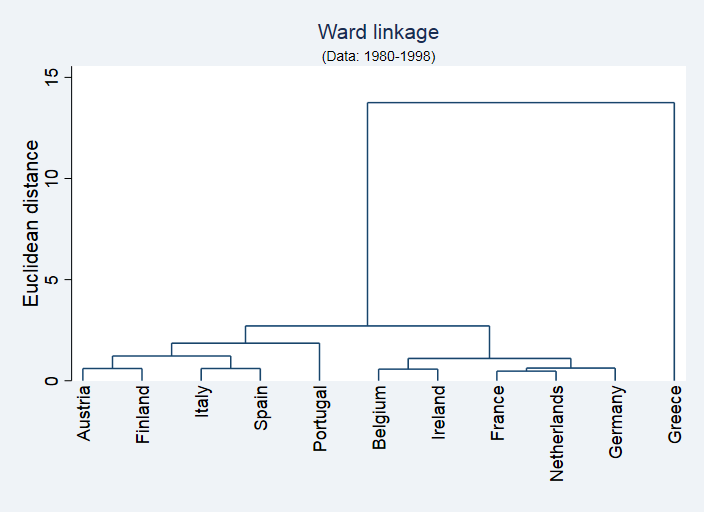
First, we look back on the debates that took place before the introduction of the euro, by considering a panel made of ten founding members of the euro area in 1999 (Austria, Belgium, Finland, France, Germany, Ireland, Italy, the Netherlands, Portugal and Spain) plus Greece which joined the union in 2001. We rely on a cluster analysis (i) to identify relatively homogeneous groups of euro-members based on their respective equilibrium exchange rate path, and (ii) to examine whether the subsequent partition of the euro area has evolved over time, specifically since the launch of the single currency. This method indeed allows us partitioning the eurozone into relatively homogeneous groups of countries without imposing any reference group or leading country as in business cycle synchronization analyses. Moreover, it provides further information on the level of heterogeneity in the euro area, by evidencing interrelationships within and between the different groups of economies. Using this methodology, we find evidence of two clusters of countries before the launch of the euro (see Figure 1). A first cluster can be identified as the “core countries”, it includes Germany, Belgium, the Netherlands, France and Ireland. A second group of homogeneous countries is made of Austria, Spain, Italy and Finland. Portugal and Greece can be considered as two outliers as they are found to be the countries exhibiting very different equilibrium exchange rate paths; Greece being the most idiosyncratic country, because of its structural weaknesses regarding the financing of its economy.
These results confirm that dissimilarities across the euro area candidates were still present at the eve of the EMU. The partition of the eurozone into different groups of relatively homogenous countries called into question the effectiveness of the Maastricht criteria in making these economies converge before the launch of the euro, and even the desirability of a unique monetary policy. Our findings comfort the view of a political driving force for monetary union, despite the economic arguments of dissimilarities between the core and the periphery.
Figure 1. Cluster analysis results, 1980-1998 (dendrogram). Note: The vertical axis of the dendrogram represents the distance or dissimilarity between the countries’ equilibrium exchange rate paths, while the horizontal axis displays the different countries. The dissimilarity measures are captured by the heights of the links.
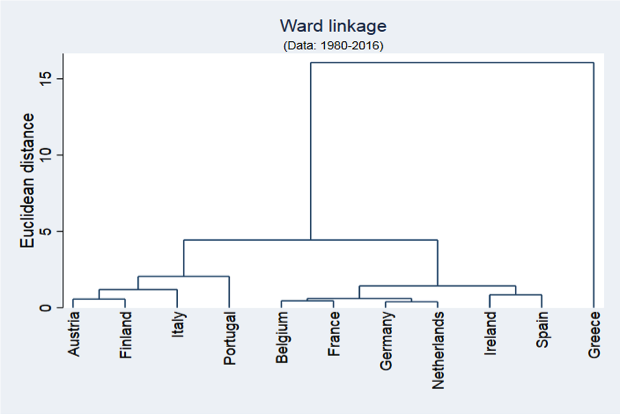
Second, we extend the analysis to the recent period in order to analyze the evolution of cluster memberships after the launch of the single currency. The results show that the configuration of the eurozone shares the same features as before (see Figure 2 as an example, similar results being obtained for various sub-samples). Indeed, there is still a set of core countries and a second group of economies, and monetary union has not reduced dissimilarities between these two clusters of countries. The peripheral countries appear to be more disconnected in sub-groupings: Italy now exhibits slightly distinct features from the other members, as well as Portugal which is linked to the peripheral set in a single element group. Greece still appears as an outlier, neither linked to core nor to peripheral members. It has even become more distinct from the other countries over time as the distance to the other clusters has increased.
Figure 2. Cluster analysis results, 1980-2016 (dendrogram). Note: The vertical axis of the dendrogram represents the distance or dissimilarity between the countries’ equilibrium exchange rate paths, while the horizontal axis displays the different countries. The dissimilarity measures are captured by the heights of the links.
Overall, our findings suggest that the configuration of the eurozone has become more fragmented since the launch of the single currency as dissimilarities across and within groups of countries have augmented. This result refutes the argument that divergences across the potential EMU member countries were due to insufficient financial integration and would be swept off by monetary union. The adjustment that followed the financial crisis has not changed the deal between countries; the clusters have not been brought closer despite all the steps that have been taken to counter imbalances.
The success of the euro during its first decade of existence may have created the appearance of a convergence process driven by abundant capital flows that fueled consumption and real estate demand in the peripheral countries without however increasing their production capacities. Since the 2008 crisis that undermined this debt-driven growth process, many steps have been taken in order to correct macroeconomic imbalances, and notably the macroeconomic imbalance procedure (MIP) that the European Commission introduced in 2011. However, too little has been done in other areas such as structural or even fiscal policies. It is now time to recognize that the conditions for an optimum currency area will not arise spontaneously by the mere effect of the single currency. Large reforms of the euro governance are still needed to ensure the optimality of the single currency. Besides, real convergence should be also dealt with, because it was not fostered automatically by monetary union as expected. It is necessary to revive the catching-up process in the Southern members, for example by channeling more EU funds to the development of specific industries, in order to maintain social cohesion inside the area.
References
This post written by Virginie Coudert, Cécile Couharde, Carl Grekou, and Valérie Mignon.


New Insights into an Old Story is exactly right. Their reference page has a lot of classics including a couple of seminal papers:
McKinnon, R. (1963). “Optimum Currency Area”, American Economic Review 53 (4): 717-725.
Mundell, R. (1961). “A Theory of Optimum Currency Areas”, American Economic Review 51(4): 657-665
Excellent discussion of the evidence. So this is a must read.
Of course I’ll bet the bank that Stephen Moore has not read any of this literature. And yet he will be put on the FED to advocate a return to fixed exchange rates. Trump hires only the dumbest people.
An update of those incredibly STUPID claims from Princeton Stevie boy who argued that the JOLTS data was superior to the BLS data and showed a better employment picture. Never mind that BLS provides JOLTS data but the point that Princeton Stevie boy is the most clueless moron ever has been well established.
NewDealDemocrat over at Angrybear gets this stuff and has a new post that I would advice Princeton Stevie to carefully read (not that Stevie will understand any of it):
https://angrybearblog.com/2019/04/february-jolts-a-mirror-of-the-poor-jobs-report.html#more-49618
‘February JOLTS: a mirror of the poor jobs report’
My even this title will send Princeton Stevie in a rage!
“The JOLTS report on labor is noteworthy and helpful because it breaks down the jobs market into a more granular look at hiring, firing, and voluntary quits. Its drawback is that the data only goes back less than 20 years, so from the point of view of looking at the economic cycle, it has to be taken with a large dose of salt.
With that disclaimer out of the way, Tuesday’s JOLTS report for February generally mirrored the poor jobs report (+20,000, revised to +33,000) for that month. With the exception of one new high, the other series are off their best levels, and two continued to decline:
• Quits declined -0.1% from their peak of one month ago.
• Hires declined and are -3% off their October peak.
• Total separations rose slightly but remain about -2% off their peak in last July.
• Job openings declined about -7% from their October all time high, which was virtually tied one month ago. While this is a sharp decline, it has typically happened once or twice a year in this series even during expansions.
• Layoffs and Discharges rose slightly and remain about 9% higher than their September 2016 low, although well below their levels of most of the past 18 months.
Let’s update where the report might tell us we are in the cycle.
First, below is a graph, averaged quarterly through the fourth quarter, of the *rates* of hiring, quits, layoffs, and openings as a percentage of the labor force since the inception of the series (layoffs and discharges are inverted at the 3% level, so that higher readings show fewer layoffs than normal, and lower readings show more):”
NewDealDemocrat continues by comparing this to earlier periods with some information graphs. Oh but wait – he used FRED to draw those graphs. I expect the usual foot stomper and temper tantrums from Princeton Stevie boy!
It is necessary to revive the catching-up process in the Southern members, for example by channeling more EU funds to the development of specific industries, in order to maintain social cohesion inside the area.
I wonder how politically feasible this is given that many of the EU countries are not in the euro currency union and therefore have little incentive see the euro succeed.
It would be interesting to see the relative GDP of those who are in (France, Germany, etc) and those that are not (UK, Sweden, and a bunch of nations with tiny GDPs. Of course one could just eliminate this Euro experiment. Every smart economist knew it would be a mistake and their predictions have been proven correct BIG time.
At first I thought the authors might even be arguing against the one common currency. But it appears they still like the one currency, but want an EU political structure more conducive to fiscal stimulus to “the periphery” countries or the “southern” zone. I have only read the post and not the paper (which no doubt has some math that I would at the very least “grapple” with if not come up short in fully understanding). But from what I can tell, it appears to be a solid paper and beneficial to the current EU dialogue. I hope the paper gets the attention it deserves and I’m thankful the scholars Coudert, Couharde, Grekou, and Mignon were willing to bestow to the readers of this blog their knowledge and diligent work.
Will try to make time to read the more detailed paper and maybe even grapple with the math soon. And maybe I would have something more intelligent to say then.