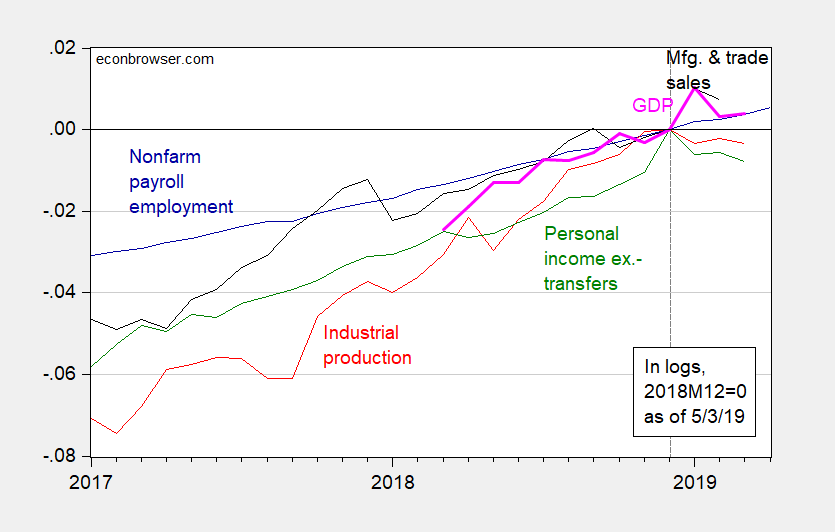
That’s from Macroeconomic Advisers today. Turns out a bunch of monthly indicators have recently been released, including today’s employment report. Here are some key ones followed by NBER’s Business Cycle Dating Committee (BCDC).
Figure 1: Nonfarm payroll employment (blue), industrial production (red), personal income excluding transfers in Ch.2012$ (green), manufacturing and trade sales in Ch.2012$ (black), and monthly GDP in Ch.2012$ (pink), all log normalized to 2018M12=0. Source: BLS, Federal Reserve, BEA, via FRED, Macroeconomic Advisers, and author’s calculations.
Note that normalizing on 2019M01 would have been reasonable as well. Monthly GDP and manufacturing and trade sales peaked in January (as far as we can tell from the reported data).
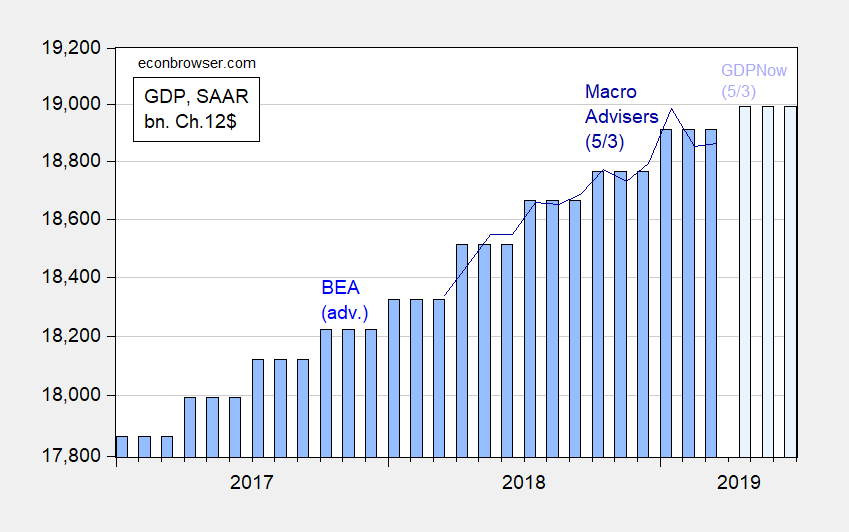
While the official advance estimate on GDP surprised on the upside, high frequency indicators (like the monthly GDP series from Macroeconomic Advisers) and nowcasts such as those from the Atlanta Fed suggest a slowdown (I know there has been some confusion as to what the word “suggest” means; here I use it synonymously with “hints at”).
Figure 2: Official quarterly GDP (blue bars), MA monthly GDP (dark blue line), and Atlanta Fed GDPNow for 2019Q2 (light blue bars), in billions Ch.2012$ SAAR, all on log scale. Source: BEA 2019Q1 advance release, Macroeconomic Advisers 5/3/2019 releases, Atlanta Fed 5/3 release.
Given continued robust growth (albeit in GDP, and not necessarily in final sales or in final sales to domestic purchases), the decision to maintain the current stance of monetary policy seems not unreasonable.
One thing to remember, however; the yield curve remains inverted between the 6th month and 10 years maturities.


Oh my – that inventory build-up lost steam. Brad DeLong has been thinking about the data and he suggests that import surge was temporary as well. Shhh – don’t tell the Trumpster as we cannot endure any more Trump twitter rages!
Great post by Menzie. Certainly topical among other good things.
I thought this was pretty good journalism, so I wanted to share.
https://www.washingtonpost.com/politics/watergate-had-the-nixon-tapes-mueller-had-annie-donaldsons-notes/2019/05/03/d2b1bc62-66b5-11e9-8985-4cf30147bdca_story.html
I hope everyone has a great Friday. Including those “poor souls” kicked off Facebook. People, it’s a private company that violates your privacy every day, from its inception as a “going concern” clear to this day—this hour—this minute—this second. As a private company they have a right to boot whoever they want, including those who mooch off of its FREE services (You got that, moocher Paul Joseph Watson??). If you don’t like it, create your own platform or join another platform. Or just do what I do, and don’t use a company’s services that violates your privacy. You illiterate morons don’t even know what privacy is anymore. If Facebook isn’t stealing it from you, you’re volunteering your privacy up on a silver platter to Instagram, and so are your children. You can’t wait to tell everyone about your trip to Hawaii so 5 minutes after you left the house you’re being robbed blind. Gee, how did those confounded robbers know??
Again, have a great Friday people.
oy,
I said that BEFORE Brad on this VERY blog.
A monthly GDP figure.
Even more useless that an ‘advanced GDP measure that niot only uses its own forecasts for figures it does not have but also uses anuualised figures not SAAR.
you yanks are strange people
Not Trampis: Seems to be a demand for this, given Macro Advisers has had a series for quite a while. UK ONS has released a monthly GDP series too.
PGL,
I was wondering if you can do me a favour.
On my modest blog ( Winston Churchill would sat it is a modest blog with much to be modest about) I was wondering if you could run a critical eye over the latest post Around the traps. you are sometimes on it as is Menzie.
If you do not wish to that is understandable
Interesting – sort of what Thoma is doing. This discussion of public v. private schools caught my eye!
https://theconversation.com/public-schools-actually-outperform-private-schools-and-with-less-money-113914
People have done shotgun links for a long time. Unless you can provide super high quality links and do it day in and day out doggedly like Thoma does, in my opinion it’s semi-lazy blogging. I’m not saying it’s meaningless, but you have to be super good at amalgamating (which most people aren’t). Naked Capitalism does one. “FT Alphaville” does one. There was another guy, I’ve gone blank on his name–he used to work at Reuters and then when the economic crisis tapered off he got less and less attention and then had a meandering podcast he had to share connected to Slate magazine. I was never a big fan but he went through a “phase” where he was pretty good at amalgamating things on his blog. If anyone knows the name of the dude I’m talking about you can put it in this thread, that would be great. Middle aged dude with a British accent.
I did a key word search and found the guy’s name who was pretty good at the shotgun links. Felix Salmon. First I heard of him he was at Reuters, then seemed to shrink in popularity and was working at Slate, and now, drum-roll please…….. Felix Salmon is at……. Axios. This is a Twitter bot with links to his work:
https://twitter.com/felixbot
He also has a “free” newsletter that comes out once per week, but be advised, sometimes those things can junk up your email because then “Axios” or whoever starts to try to sell you on premium or paid content you have ZERO interest in. That’s always the bargain you make on these “free” newsletters, which is why I lean on RSS feeds mostly, and if Axios gives Salmon an RSS feed on the site that is what I would advise using over the email clutter.
http://link.axios.com/join/edge-signup?utm_source=twitterPinnedtweet
Menzie,
maybe a demand but people should really say it is meaningless
Not Trampis: I don’t think it’s any more useless than CFNAI for instance. But I admit I haven’t seen a systematic evaluation of accuracy.
Not sure what to make of Figure 1 in the light of this: https://www.bea.gov/news/glance
Real personal income series seemed to have an anomalous value for December 2018 (your base point). https://fred.stlouisfed.org/series/W875RX1 . November 2018 was 13615 versus 13653 in March 2019.
Industrial Production Index (110.2) has flattened since December 2018 high (110.6), but still remains fairly high and certainly not falling like the Nov. 2014 to May 2016 period (106.6 to 101.4) under different economic policies.
“Real personal income series seemed to have an anomalous value for December 2018”.
Anomalous you say? Take a look at Feb. 2015 or March 2017 and you see the same thing. Personal income showing a bit of noise. Stop the presses. Bruce Hall has a dissertation topic. Or maybe not.
pgl, you really have personal issues, don’t you? Inability to discuss anything without ad hominem remarks. I imagine life with you would be hell for a spouse.
Now, are you disputing the point that December appears to be anomalous and might be a poor choice of a comparison? Or are you trying to justify a personal attack by pointing out that there have been some occasions in the past when that has occurred? If the former, please elucidate? If the latter, never mind.
No comment regarding my comment concerning IPI?
Ah Bruce – I do have a real problem with pointless sniping which is what you do a lot. Now if you might bother to “educate” us why your little series is any qualification of what our host posted – then maybe we might appreciate your very thoughtful point. In the meantime – cut the cry baby routine.
Bruce Hall Menzie’s chart shows personal income ex transfers whereas the BEA headline number is personal income including transfers.
As FRED notes, current transfer receipts were excluded:
‘U.S. Bureau of Economic Analysis, Real personal income excluding current transfer receipts’
Why someone would think excluding this has any meaning but since Bruce Hall wants this to be his dissertation project, let’s help do some real research:
https://apps.bea.gov/iTable/iTable.cfm?reqid=19&step=2#reqid=19&step=2&isuri=1&1921=survey
Table 2.1. Personal Income and Its Disposition
Personal current transfer receipts is line 16.
Knock yourself out Bruce!
2slug, thanks. I appreciate your looking at that. However, the title of the link I provided is “Real personal income excluding current transfer receipts (W875RX1)” . https://fred.stlouisfed.org/series/W875RX1
Yea we got that. Pointless sniping. But do act like a cry baby when one of us points that out.
Bruce Hall If you look at BEA table 2.1 you’ll see that the uptick in Dec shows up in the 2018:Q4 data as an increase in line 13, Personal Income Receipts on Assets; i.e., interest and dividends. As I noted in an earlier comment, that’s the same category that showed a drop in 2019:Q1. It looks like the top 0.01% got themselves some nice Xmas presents in December.
Bruce’s little graph is sort of doing it Kudlow style. You may remember when he wanted to calculate GDP by including exports but not deducting imports. Funny thing – had we followed Kudlow’s advice for 2019QI, reported GDP growth would have been lower!
It is a wonderful thing that trolls like Bruce Hall and Lawrence Kudlow trip over their own shoe laces so often!
pgl, you really have nothing of value to add, do you?
First of all, if you want to reference another post, you should indicate so. Otherwise, your comment is a non-sequitur since I did not comment specifically on GDP (you might note that Figure 1 to which I referred has four variables). But if you are referencing the little graphic showing the Fed interest rate rollercoaster (from a previous post), then I’m glad I was able to simplify it enough for you … even if you don’t like the implication that the Fed tends to trigger recessions and then has to overreact to correct the problem.
So, when it comes to trolling, you are a fisherman extraordinaire. Too bad you don’t use the right bait and forgot your net.
More whining!
In my comment to JDH’s post on GDP growth I highlighted BEA’s statement on personal income. The BEA statement didn’t seem to get a lot of media attention at the time.
https://econbrowser.com/archives/2019/04/u-s-economy-keeps-growing-2#comment-224123
Menzie’s graph reinforces the point (see the green line).
Good point on inventory accumulation. DeLong noted this as well as what he deemed to be a temporary surge in imports.
Firstly thanks PGL,
Secondly I would have thought anybody who thinks this could be useful would test it to see if it is.
Thirdly I protest. On this very blog on the Jim’s article of the silly advanced estimate you yanks love to look at on an annualised bsais I made the very points Brad has but I made them before Brad.
I am taking this to court!!
Dude, why are people in the Netherlands better at cooking barbequed kangaroos than Australians???
https://www.youtube.com/watch?v=QhyaaD0FHFw
Come on bro, this is embarrassing!!!! Get the spit roast out and start working on this. You’re missing out on a huge export market. It’s good that Crocodile Dundee is almost 80 now, hopefully he is not aware of this.
When you go to court – resist the temptation of hiring this guy as your attorney!
https://www.newsweek.com/rudy-giuliani-gets-fact-checked-legal-experts-including-george-conway-over-1414707
This feels a bit misleading. GDP is slowing, but the composition of growth looks like it has improved. The Atlanta Fed Nowcast has consumption and nonresidential investment stronger in Q2. Final sales to private domestic purchasers (GDP net of government, trade, inventories) adding to 2.5%, about double the pace of Q1.
Neil: Just looked at GDPNow. As of 5/7 noon Central, https://www.frbatlanta.org/cqer/research/gdpnow.aspx I see 1.7% (5/3 release). Do you have access to a different source (internal?) I don’t know of?
https://www.frbatlanta.org/-/media/documents/cqer/researchcq/gdpnow/RealGDPTrackingSlides.pdf
If you open this PDF and take a look at page 5, you will see the underlying details. They have a big drag from inventories (about a full percentage point off growth). That makes sense, but implies a better composition to growth in Q2.