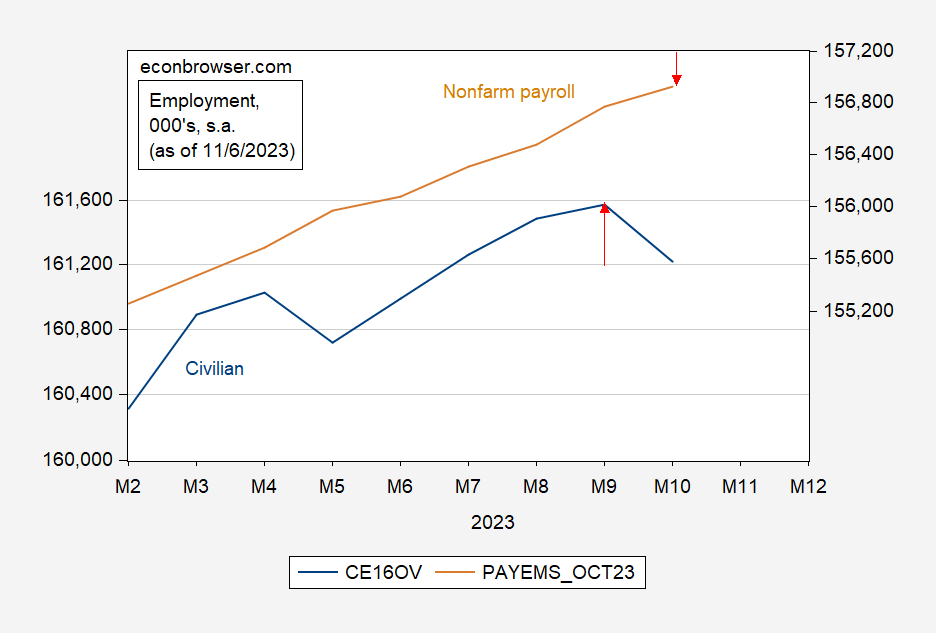
Does this mean we should be expecting the recession, in next month’s or month after’s data? Maybe, maybe not.
Figure 1: Civilian employment over age 16 (blue, left log scale), nonfarm payroll employment (tan, right log scale), both in 1000’s, seasonally adjusted, both as of 11/3/2023. Source: BLS via FRED.
Consulting the currently available data over the past four recessions, one would find that in two cases the household series peaks before the establishment — in one case three months earlier. However, the results are somewhat different in real time, i.e., as observers were contemporaneously assessing the onset of a recession
Figures 2-5 show the real time assessments (see this post for a discussion of final data vs. real time).
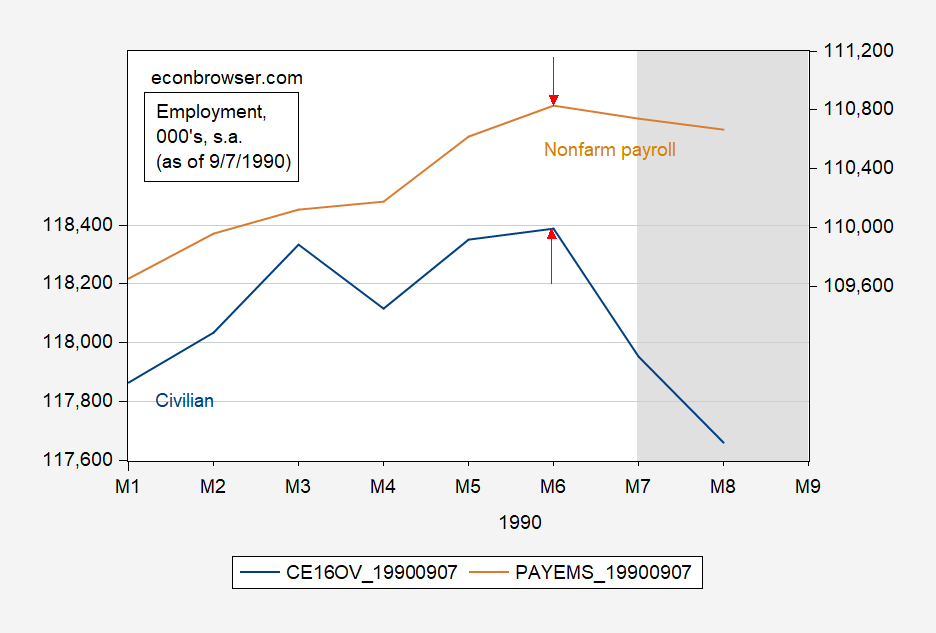
Figure 2: Civilian employment over age 16 (blue, left log scale), nonfarm payroll employment (tan, right log scale), both in 1000’s, seasonally adjusted, both as of 6/7/1990. NBER defined peak-to-trough recession dates shaded gray. Source: BLS via ALFRED, NBER.
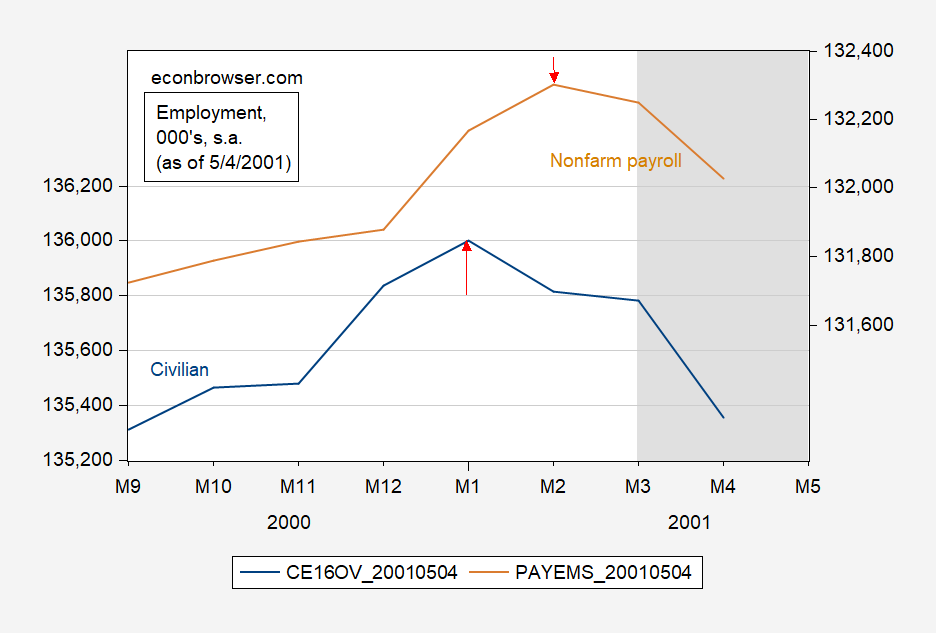
Figure 3: Civilian employment over age 16 (blue, left log scale), nonfarm payroll employment (tan, right log scale), both in 1000’s, seasonally adjusted, both as of 5/4/2001. NBER defined peak-to-trough recession dates shaded gray. Source: BLS via ALFRED, NBER.
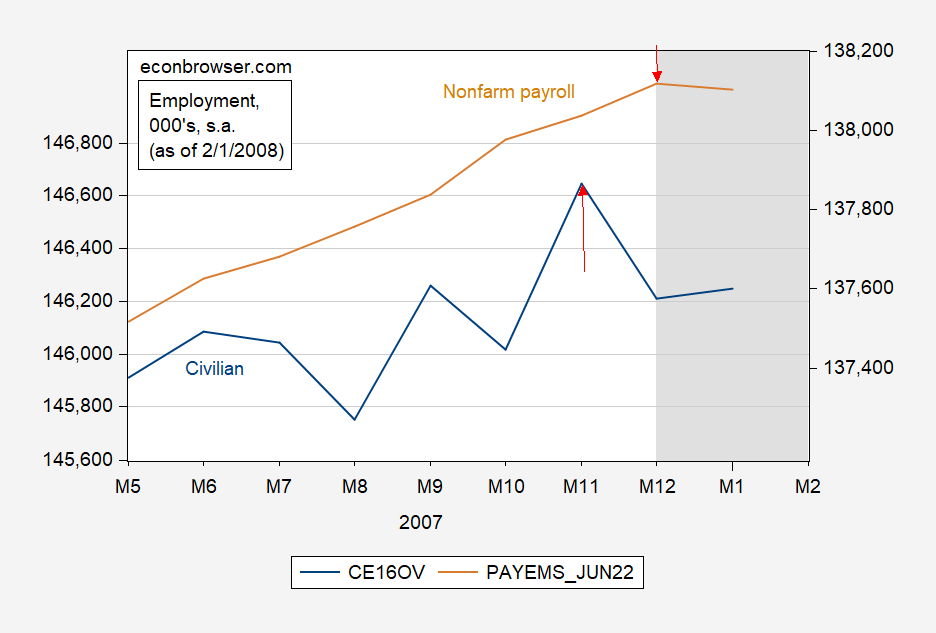
Figure 4: Civilian employment over age 16 (blue, left log scale), nonfarm payroll employment (tan, right log scale), both in 1000’s, seasonally adjusted, both as of 2/1/2008. NBER defined peak-to-trough recession dates shaded gray. Source: BLS via ALFRED, NBER.
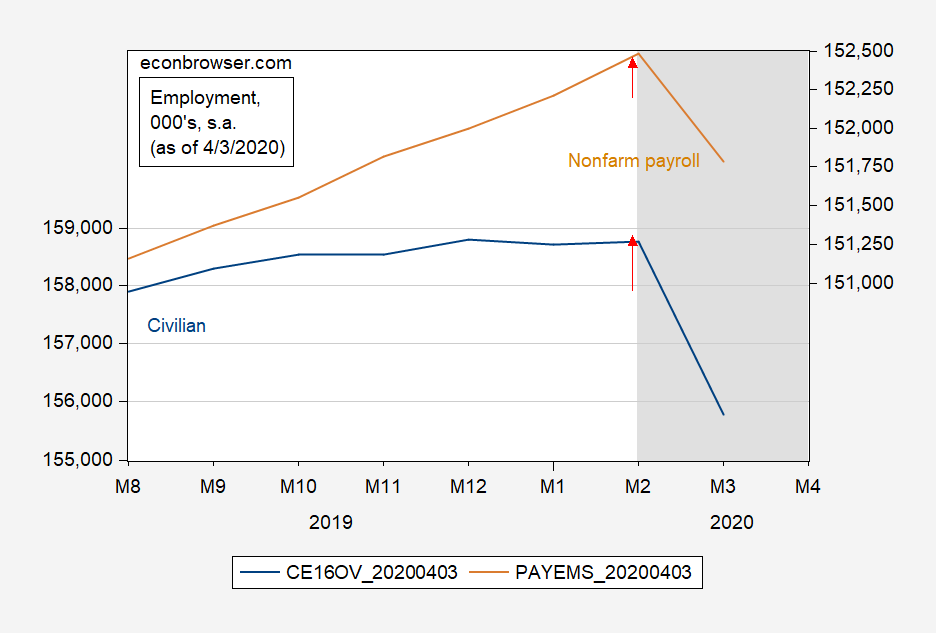
Figure 5: Civilian employment over age 16 (blue, left log scale), nonfarm payroll employment (tan, right log scale), both in 1000’s, seasonally adjusted, both as of 4/3/2020. NBER defined peak-to-trough recession dates shaded gray. Source: BLS via ALFRED, NBER.
In real time, the household series turns one month earlier than the establishment in two cases (2001, 2007), and twice the turning points are the same time (1990 and 2020). In the revisions, the civilian series peaks are moved earlier once (1990), and later by two months (2001). The NFP peak is moved later once (2001 recession).
Extrapolating from the past is always a hazardous enterprise. We now know response rates for the initial reading of the establishment survey has declined substantially, from 60% pre-pandemic to 42% in June (although the final reading is not as bad, roughly at 94%). The household series has also experienced a declining response rate, at 70% in July 2023, vs. 82% just before the pandemic.
In general, most practitioners place almost total weight on the establishment series, which makes sense as the standard deviation of (annualized) m/m growth rates since 2000 of the household series is 3%, and establishment is 2% (where I’ve omitted 2020M02-2022M01). Another way to look at this: the percent drop in civilian employment was larger in April 2022, and almost as large in May 2023. Drops twice as large (in percentage terms) occurred in October 2017 and August 2018 (in preliminary releases) without a recession coming.
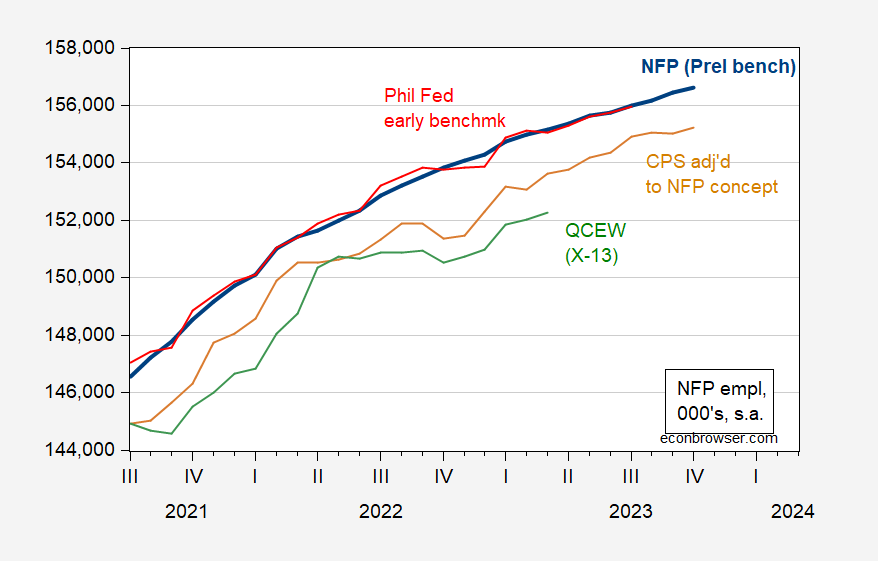
In any case, it then makes sense to cross-check the data. Here are several indicators of employment growth corresponding to the NFP concept, where the QCEW series does not rely on the BLS birth-death model and the survey response rates. The Philadelphia Fed early benchmark relies on survey data for the period after Q1.
Figure 6: NFP employment incorporating preliminary benchmark calculated by author (bold blue), Philadelphia Fed early benchmark (red), household employment adjusted to conform to NFP concept (tan), and QCEW covered employment adjusted by Census X-13 by author (green), all in thousands, seasonally adjusted. Source: BLS via FRED, Philadelphia Fed, BLS, BLS-QCEW, and author’s calculations.
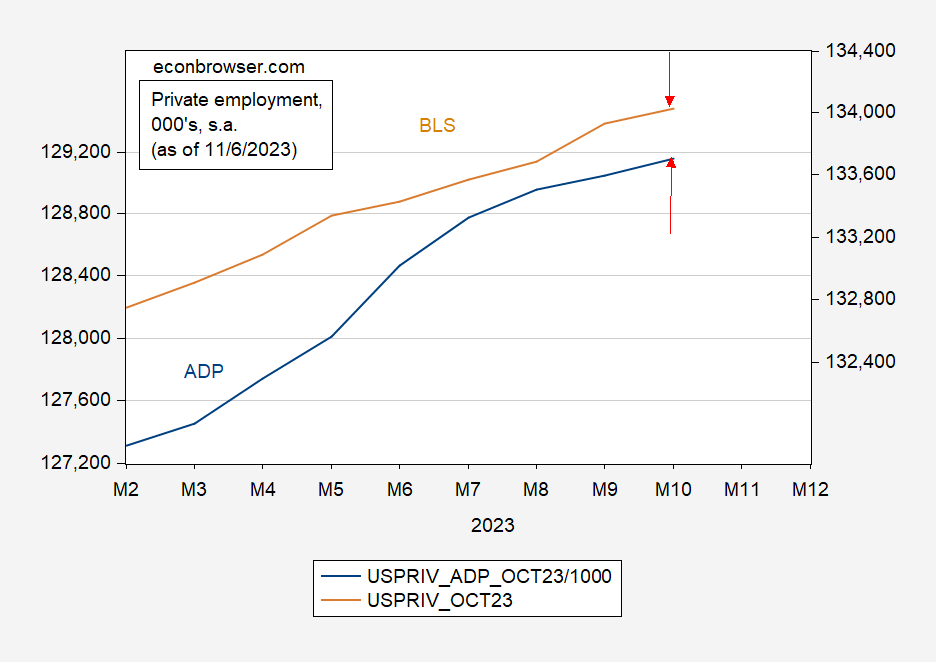
Another check is for private employment, using ADP data.
Figure 7: Total private nonfarm payroll employment, from BLS (tan, right scale), from ADP (blue, left scale). Source: BLS, ADP via FRED.
Final mowing for the year today. Not gonna miss it!!!! Just only some branch cutting on the fence and weed cutting near the house left to do. I’ll have ONE more run with the Ryobi weedwacker up close to the house, but unless it gives fits during that final run for this year, I’m very happy with my Ryobi purchases. Battery recharges and all.
Recession?? Don’t see it until we get into the ’24 year. Of course the odds would have been lower if Powell wasn’t such a damned idiot. Good luck with that.
Let’s not forget that the household survey pretty routinely reports job monthly job losses when the economy is nowhere near recession:
https://fred.stlouisfed.org/graph/?g=1b3LQ
As for historical comparisons, the payroll survey has recently shown considerably more strength than in contemporary vintages of data prior to recessions.
As of February, 2008:
https://alfred.stlouisfed.org/graph/?g=1b3EQ
Notice that the household series had begun tossing out sharply negative employment changed as of April, 2007, and that the payroll employment series was averaging gains of under 100,000 jobs per month for some time.
As of April, 2001:
https://alfred.stlouisfed.org/graph/?g=1b3Kd
The payroll emoployment series, while turning in a couple of strong months immediately prior to the onset of recession, was averaging below 100,000 per month in the year prior to recession.
Recently, payroll employment gains have been averaging well over 200,000 per month. That’s with most of the recent data, in “final”, with a response rate around 94%.
My little knees are knocking together over the likelihood of recession in the next few quarters, but a tour through earlier vintages of jobs data doesn’t suggest a recession getting underway now.
For those concerned (or not) about commercial real estate, from Statista’s latest email:
“According to real estate specialist Jones Lang LaSalle (JLL), office vacancy rates are higher than ever, reaching 21 percent in the U.S. and Canada in Q3 2023 and 16 percent globally, i.e. in the 100+ markets analyzed by JLL Research. In both cases, that’s an increase of 60 percent compared to pre-pandemic vacancy rates, which stood at 13 and 10 percent in North America and globally in Q3 2019, respectively. At the end of June, WeWork operated 906,000 workstations in 777 locations across 39 countries, with total (current and long-term) lease obligations amounting to $14.2 billion.”
As I pointed out recently, the latest rise in U.S. vacancies has a lot to do with deliveries of new space. The WeWork problem is probably beginning to show up in the data – it didn’t appear out of nowhere – but there is plenty more to come. So both supply and demand will be adding to over-capacity for a while.
Peter Coy: “A lot of Democrats are bewildered by why their party isn’t doing better in campaigns against a Republican Party that is deeply dysfunctional. A new paper by three economists proposes a fresh explanation that seems persuasive to me. It says the Democrats went astray right around … 1976…
To understand the party realignment, the three economists analyzed results of more than 800 surveys of about two million respondents since the 1940s. They also studied congressional voting records, party platforms and data on donations. They found that at least since the 1940s, “less educated voters appear to prefer a less market-based and more interventionist economic program that aims to promote domestic employment and wages.” Those voters left the Democratic Party when the party left them.” https://www.nytimes.com/2023/11/06/opinion/democratic-party-inequality-biden.html
Sounds about right. I was slow. I voted for John Anderson in 1980 but didn’t leave the Democrats until 1996, when it became painfully obvious that Democrats had sold out and decided to abandon New Deal ideals. Since then I have consistently voted third party as a protest vote.
It’s good to see these three NBER economists making positive contributions that don’t just look at very positive aggregate numbers and then express bewilderment at why so many voters don’t understand that happy days are here again.
FWIW I believe the upcoming unemployment rate would need to be around 4.3% for the Sahm Rule to signal a recession. Or maybe that’ll be an exception to the rule. The epistemological point may be that “recession” doesn’t have an accepted clearly quantified meaning among the public or ‘experts’.
No worries, if it hits its mark Sahm will be reminding us on her Substack.
Econned: If the November reading is 4.3%, then essentially the trigger will be hit in November. If the November reading is 4.1%, then 4.1% in December will trigger the recession call in December
There is a 50+ year reliable history that initial jobless claims lead the unemployment rate:
https://fred.stlouisfed.org/graph/?g=1b4EW
Although I show absolute numbers above, it probably shows better when calculated as a YOY%age. With only 1 exception (1995), if initial claims are higher by 12.5% YoY and stay that way for 2 full months, a recession has shortly followed.
We came close earlier this year, but didn’t quite cross the warning threshold before initial claims came back down.
Based on that earlier increase in initial claims, I forecast the increased unemployment rate that has now come to pass. With initial claims having decreased substantially since August, in coming months it is more likely that the unemployment rate goes down than continues up, and the Sahm rule will not be triggered.
For the same reason, forecasting using initial claims rather than the unemployment rate *always* makes the recession call before the Sahm rule.
There is a similar leading relationship between continuing claims and the number of long term unemployed, and a coincident relationship between continued claims, averaged monthly, and the unemployment rate:
https://fred.stlouisfed.org/graph/?g=1b4GK
I mention this because a few commentators have pointed out that long term unemployment has crossed a threshold (higher 15% YoY) where a recession has always occurred. But the YoY plateauing of continued claims forecasts that long term unemployment will not significantly worsen.
I don’t think Larry “the beatings will continue until morale improves” Summers’ world view will be satisfied until us working people have a recession. Completely unnecessary of course.
Menzie – because you have posted on climate change before – I would point out this opinion by M. Mann – a second Trump admin would destroy any chance we have of staying below a 2 degree temp increase with catastrophic results for the climate: https://thehill.com/opinion/energy-environment/4290467-trump-2-0-the-climate-cannot-survive-another-trump-term/
Also these Southern Red state governors need to start understanding that global warming is real and they are making their states unlivable with their pro-fossil fuel policies: https://www.dallasfed.org/research/swe/2023/swe2309
“a second Trump admin would destroy any chance we have of staying below a 2 degree temp increase with catastrophic results for the climate”
A 2nd Trump administration is exactly what little CoRev is pushing for as little CoRev has declared global warming has massive benefits.
Yea – little CoRev is a moron.
Hotter summer days heat up Texans but chill the state economy
Aparna Jayashankar, Prithvi Kalkunte, Anil Kumar and Pia Orrenius
October 18, 2023
This is an interesting paper. Of course Bruce Hall and CoRev will accuse the Federal Reserve of Dallas to be some Communist front.
To me this is one of the funner things in Economics. Not the Sahm rule, but trying to guess where U-3 will come in. It’s like watching sports in general or sports gambling. “How will the 49ers do when Bill Walsh retires??” “Can Barry Switzer win a world Championship with the Cowboys??” “Will Lincoln Riley fire his DC before the season ends??” The selfish side of me wants the recession to be marked after ’23 ends as that is what I predicted would happen. But another side of me sort of sadistically wants to see the recession occur because I strongly believe Powell kept rates too high for too long, and his record should be stained for that error. So, yes, real people in real life get hurt on all these questions, but I do kind of get a spectator kind of emotional charge out of observing it.
I’ve seen two good predictions sources for November U-3 at 3.9%. Maybe not as good as IHS Markit predictions, but pretty solid.
I don’t have any particular insight into the odds of an oil embargo against Israel or Israel’s supporters, but the public across much of the Gulf region is eager to see action on behalf of Palestinians. The Western press hasn’t given the threat of embargo much attention. Here’s something from the region itself:
https://amwaj.media/media-monitor/iran-doubles-down-on-muslim-embargo-on-israel-amid-dual-messaging-on-gaza-war
Is that screwball paraplegic?? I think I’ve seen the man 50+ times on TV and never once saw him standing. How’d you like to be his personal aide?? Reminds me when I was a kid and my fake handicapped aunt (on my white trash mother’s side) visited us for Christmas for 2 weeks and decided I was the dunce who was going to fetch her Diet Cokes.
Sunni nations like Saudia Arabia are not likely going along with anything Iran wants. Just saying.
Most experts got suddenly quiet on services inflation. Maybe they’re angry about Apple TV prices??
This explains much of what we hear from the troll choir. It’s also notable that the 40% figure is not much higher than the share of the voting public registered as Republicans:
https://bigthink.com/neuropsych/people-choose-willful-ignorance/
Department of Economic and Social Affairs Statistics Division
2022 International Trade Statistics Yearbook Volume I
Trade by Country
https://comtradeapi.un.org/files/v1/app/publicationfiles/2022/VolI2022.pdf
All sort of interesting data. Its headline number is that merchandise trade for the world was just shy of $50 trillion (as compared to World GDP near $100 trillion).