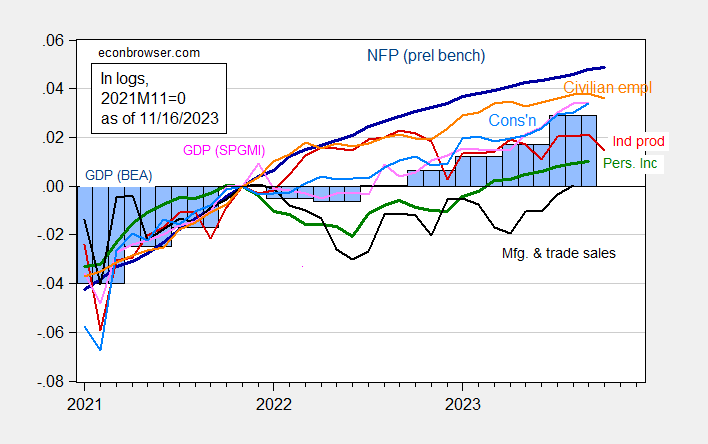
Industrial production is out, -0.6% m/m vs. consensus -0.3%. Here’s the picture of business cycle indicators followed by the NBER’s BCDC, along with SPGMI’s (nee Macroeconomic Advisers) monthly GDP:
Figure 1: Nonfarm Payroll employment incorporating preliminary benchmark (dark blue), civilian employment (orange), industrial production (red), personal income excluding transfers in Ch.2017$ (green), manufacturing and trade sales in Ch.2017$ (black), consumption in Ch.2017$ (light blue), and monthly GDP in Ch.2017$ (pink), GDP (blue bars), all log normalized to 2021M11=0. Source: BLS via FRED, BLS preliminary benchmark, Federal Reserve, BEA 2023Q2 third release incorporating comprehensive revisions, S&P Global/IHS Markit (nee Macroeconomic Advisers, IHS Markit) (11/1/2023 release), and author’s calculations.
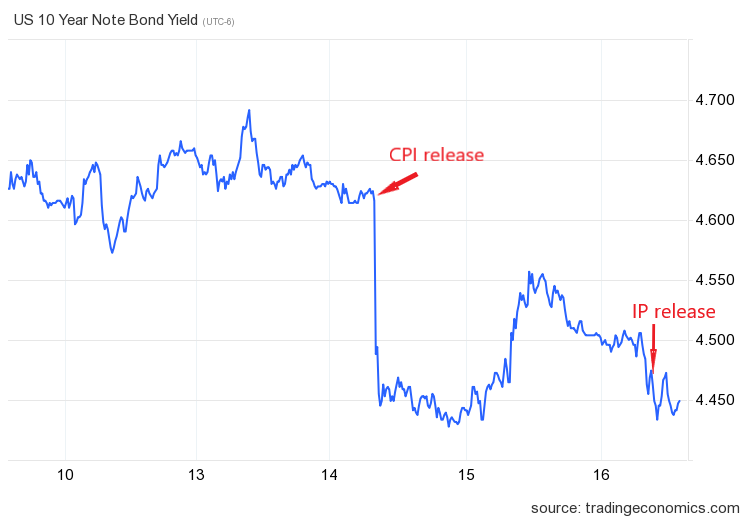
The downside surprises in the CPI and industrial production seem to have pushed down ten year Treasury yields, while the PPI surprise had little effect.


Years and years ago it seems like there was a guy named Meyer or Meyers, who started IHS Markit under it’s very original fruition. I remember admiring how good they were at knowing what the Fed would do next, but also being mildly annoyed because it seemed like Meyer/Meyers was using some kind of cronyism to get his insider take on Fed moves. If Menzie wants to take pity on a guy sipping bourbon on a Thursday night and tell me if my memory is correct or what I might be getting juxtaposed in my mind, it would be so nice of him.
Speaking of interest rates, I listened to some supposed expert on intercompany financing yesterday only to realize this guy was quite clueless (some webinars are a waste of time). At one point he told everyone that longer terms rate were necessarily higher than shorter terms rates. Macroduck gets credit for pointing this out to me:
https://www.ustreasuryyieldcurve.com/
US Treasuries Yield Curve
I did say the presenter was clueless.
I’m half drunk (no joke) can you give the EXACT link??