Of the BLS, that is. From EJ Antoni writing in Heritage, “Why the Labor Market Is Stronger Than Experts Think”:
The mainstream media was predictably quick to denounce the labor market as weak according to November’s jobs report, but the talking heads are simply wrong. That alleged weakness is almost entirely confined to government bureaucrats and foreign workers, while private industry is employing more Americans.
Antoni, in a particularly telling moment, elides “foreign” with “foreign born”, as there is no CPS series on “foreign workers”.
Continuing:
This was the best November ever for employment among native-born Americans, up more than 2.6 million over the last 12 months and setting a record, albeit on a non-seasonally adjusted basis. Conversely, the number of foreign-born workers with jobs declined over this period by 21,000.
This means that all the net job growth over the last year has gone to American workers, not their foreign-born counterparts. It’s a stark contrast to November 2024 when Joe Biden was president and native-born Americans saw an annual loss of almost 1.1 million jobs. During those 12 months, all net job growth went to foreign-born workers.
As an aside, Antoni again slides in again “American” for “native-born Americans”, which in my mind is just a replay of Antoni’s previous “Great Replacement” Theory screed.
Using the official BLS numbers, I obtain the following series (bold black) in Figure 1:
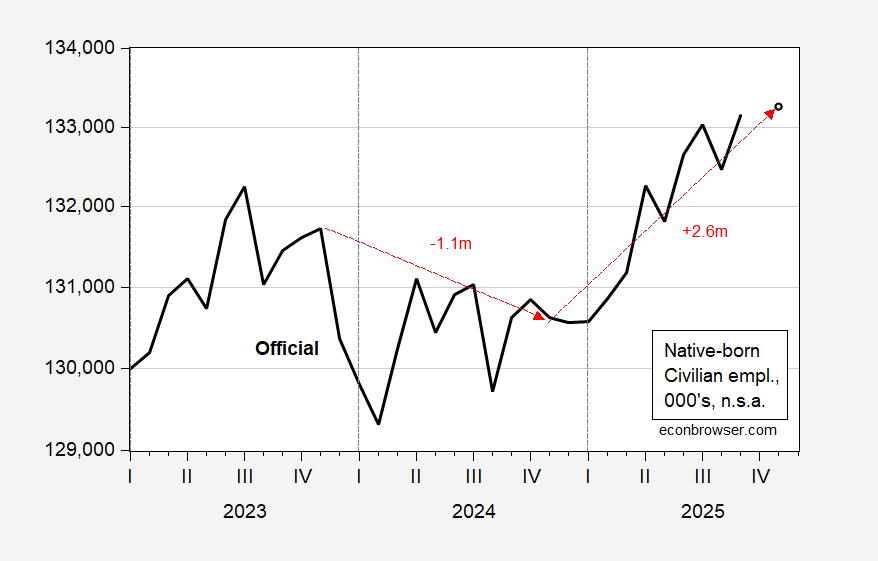
Figure 1: Official native born employment (bold black), in 000’s, n.s.a. November to November change in employment, red arrows. Vertical dashed lines at new population controls. Source: BLS via FRED. [Corrected]
These numbers do match the official calculations. However, if one plots the level of official employment series (FRED series CE16OV), one notes that there might be an issue taking the official series at face value (bold black series in Figure 2).
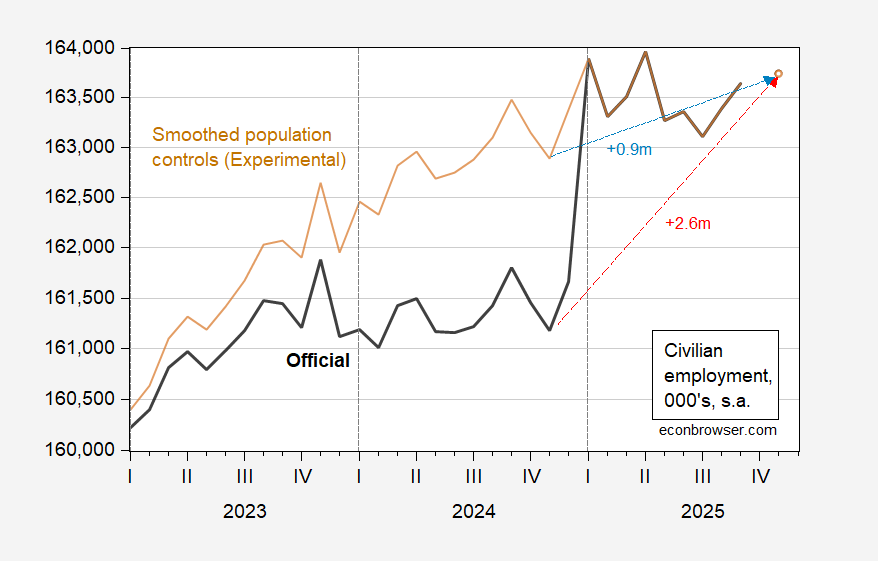
Figure 2: Official civilian employment (bold black), in 000’s, s.a. November to November change in employment, red arrows. Vertical dashed lines at new population controls. Source: BLS via FRED, BLS.
If one looks at Figure 2, without understanding the way in which the civilian employment series is calculated, then one might think there was an “astonishing” jump in employment in Jnauary 2025. The fact is that each year, new population controls are implemented; when the controls differ substantially from the preceding (or succeeding) year, then jumps — that are purely statistical artefacts — can be exhibited. Understanding this debate (which was quite prominent in 2024) induced the BLS to implement on a experimental basis alternative, “smoothed”, population controls. These alternative calculations yield the tan line in Figure 2. As is shown, instead of the +2.6 million increase, one obtains +0.9 million, y/y through November. While Antoni doesn’t cite overall increase, he should understand similar concerns apply to the level of native-born and foreign-born employees. In fact, he has been corrected on this count several times before, see here.
Unfortunately, BLS does not publish an experimental version of the native-born/foreign-born series (to my knowledge). Hence, I estimate the native born level by applying the ratio of native-born to total (smoothed population control) employment. Here is the resulting addition to Figure 1, in the tan line.
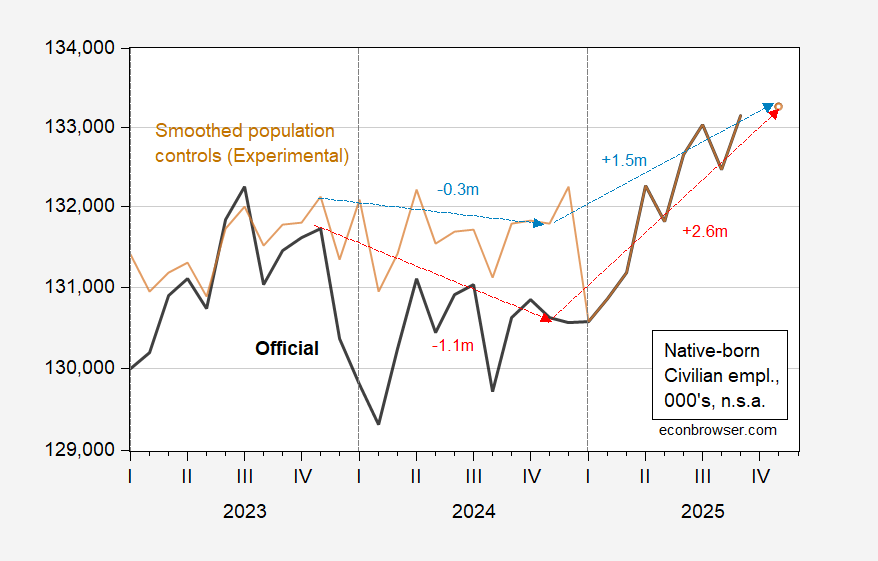
Figure 3: Official native born employment (bold black), and estimated experimental series (tan), both in 000’s, n.s.a. November to November change in employment in arrows. Vertical dashed lines at new population controls. Source: BLS via FRED, BLS, and author’s calculations. [Corrected]
The decrease in Biden’s Nov ’23-Nov ’24 native-born civilian employment (-1.1m) virtually disappears, and becomes -0.3m, while the +2.6 million Nov ’24-Nov ’25 drops to +1.5 million. In other words, Antoni should have known better to use the official series, when he knew the official employment series was subject to a structural break.
Finally, I am unsure whether I agree with Dr. Antoni’s conclusion that private industry is employing more workers. It really depends on what series you look at. If you have questions about the BLS birth-death model (as Dr. Antoni has in the past), one might look askance at the BLS series in recent months, and focus more on the ADP data.
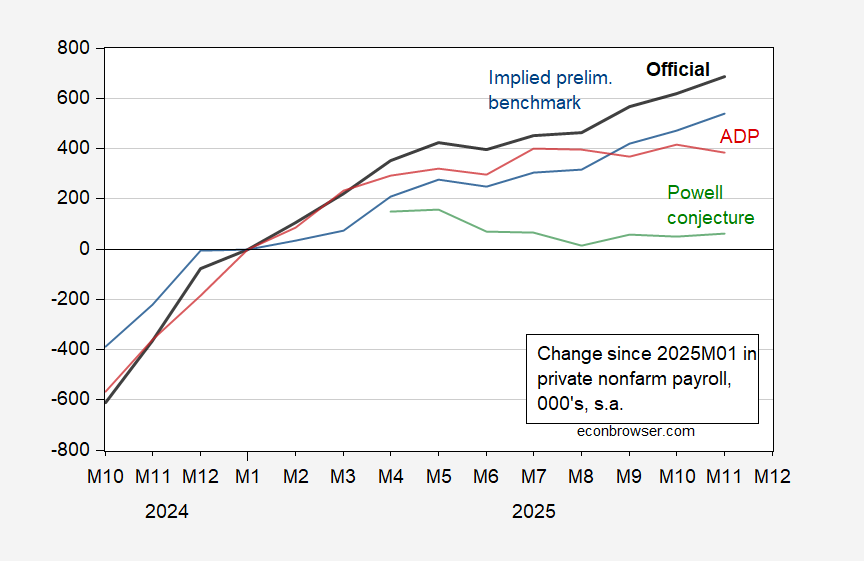
Figure 4: Change since 2025M01 of Official BLS nonfarm payroll employment (bold black), implied preliminary benchmark (blue), implied preliminary benchmark incorporating Powell conjecture (red), and ADP (red), all in thousands, s.a. Source: BLS, ADP via FRED, and author’s calculations.
Well, as they say, “A foolish consistency is the hobgoblin of little minds”.
Data used in this post https://www.ssc.wisc.edu/~mchinn/the_man_who_would_be_BLScommish.xlsx
* With apologies to Rudyard Kipling.
** Thanks to New Deal Democrat for catching data errors, the corrections of which are incorporated in this version of the post.
I replicate Antoni’s numbers using the NSA native and foreign born employment levels from the Houseold Survey:
https://fred.stlouisfed.org/graph/?g=1P0vI
Of course, as you note, “foreign born” is not “foreign.”
And while the YoY comparison May elide some of the problems with the massive January population adjustment, there is another problem: in the wake of the massive deportation drives this year, how many foreign born workers have been willing to acknowledge that to the friendly government interviewer over the phone?
New Deal Democrat: Inexplicably, he’s using September numbers–at least he comes closer then. Do the 12 month change in the FRED URL you cited. I’m using November numbers, which Antoni had at the time of writing (he in fact cites some November numbers in the article). I’ve posted data at https://www.ssc.wisc.edu/~mchinn/the_man_who_would_be_BLScommish.xlsx
Let me start out by saying I am by no means trying to defend the guy here.
Here’s the numbers I get from the graph (1st in Nov 25, 2nd is Nov 24):
Native born: 133,264 – 130,633 =2,631
Foreign born: 30,802 – 30,823 =-21
Antoni says: “This was the best November ever for employment among native-born Americans, up more than 2.6 million over the last 12 months and setting a record, albeit on a non-seasonally adjusted basis. Conversely, the number of foreign-born workers with jobs declined over this period by 21,000.”
I plead guilty to my share of senior moments, but what am I missing?
Edited to add: I don’t feel going going to the effort of finding out whether the January population adjustment was done separately for native and foreign born workers, or just apportioned by weight, but obviously that could make a major difference.
New Deal Democrat: Thanks for the corrections. I’d used labor force instead of employment. Text and graphs corrected. The correct data is online at https://www.ssc.wisc.edu/~mchinn/the_man_who_would_be_BLScommish.xlsx
Just as an additional check on whether population controls might be messed up, here are two employment series which use population controls – household employment, overall and native-born – and two which don’t – ADP and NFP. It’s pretty obvious that population-controlled series showed two big wobbles that are not present in the other two.
If one believes that a sudden change in political leadership is all that it takes to cause a big disruption in hiring, one might choose to explain away the population control issue. That still leave the vastly better labor market performance in Biden’s first three years, relative to any period under that felon-in-chief, to explain.
Only by focusing narrowly on carefully chosen data series and periods can little Antoni make his racist “things are great” claims. Presumably, that’s what Heritage is paying him to do.
Oops. Here’s the picture:
https://fred.stlouisfed.org/graph/?g=1P43N