I see a lot of ebullience in the wake of the March headline NFP number. I’m not so convinced (see here), and looking at other indicators buttresses my wariness.
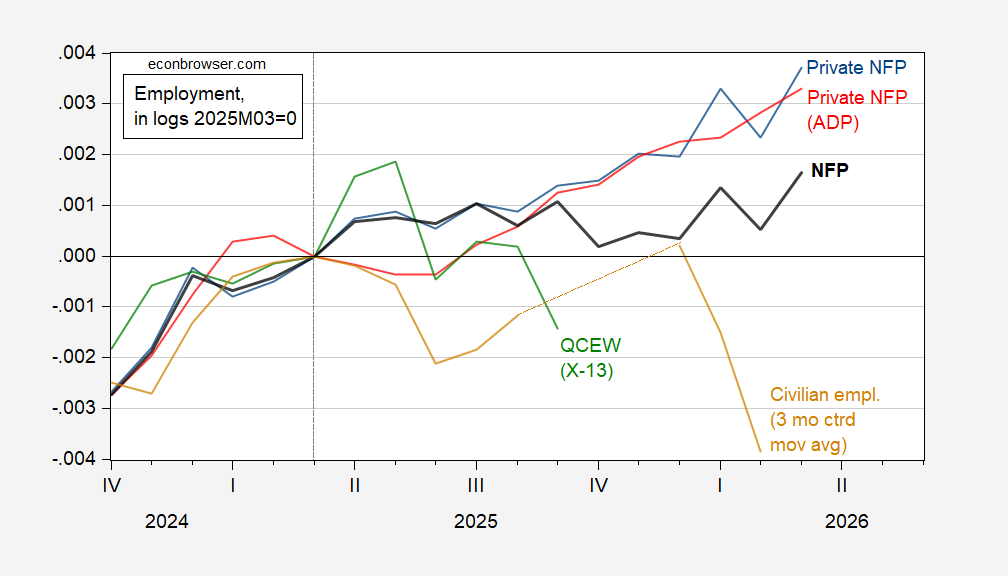
Figure 1: Nonfarm payroll employment (bold black), private NFP (blue), private NFP from ADP (red), QCEW covered employment, seasonally adjusted by author using Census X-13 (green), and civilian employment, 3 month centered moving average, smoothed population controls (brown), all in logs, 2025M03=0. Source: BLS, ADP via FRED, BLS, and author’s calculations.
Covered QCEW is hard to interpret to the extent I applied a seasonal adjustment to the reported aggregate series, whereas a more careful approach would apply the seasonal adjustment to individual components, and then sum up to aggregate. In addition, since QCEW utilizes tax records presumably for documented workers, it might undercount actual workers.
With respect to the household series, the civilian employment series is relatively noisy because of its relatively small sample size; I try to mitigate that issue by taking a three month centered moving average. However, the more challenging issue — not so readily remedied — is the sensitivity to the estimates of population controls. In an era where a tremendous amount of fear has been engendered by the internment/removals program of the Administration, the household survey may be even more affected by measurement error (both unbiased and biased).
Weekly aggregate hours -0.2%, weakest in 3 months, second weakest since May, 2025.
Weekly aggregate payrolls +0.1%, smallest gain in 3 months, second smallest since January 2025. Below the pace of inflation.
Households reported job losses.
So yeah, not so healthy. And the 3-month average job gain is a better metric of labor market performance than the 1-month gain, even before revisions. Trends, my friends, trends.
Way-the-heck off topic – Early Iron-Age trade in iron, and baffling academic beliefs regarding trade:
https://www.nature.com/articles/s40494-026-02409-7
The new fact related in this study is the discovery of iron blooms sunken in the Mediterranean near Carmel, dated from the late 7th to the early 6th century BC – a hundred years after Homer, give or take. Those iron blooms are evidence of trade in processed raw material. The implication drawn from this discovery is that iron blooms were not always forged into finished goods near where they were smelted, but were in fact traded over considerable distances. This, the authors claim, id contrary to the established belief of historians that iron was forged where it was smelted.
I wonder whether the finding that raw iron was tradrd is contrary to the belief of economists and economic historians. Economic theory certainly supports the expectation of extensive trade. Seems like every time I turn around, archeology is uncovering new evidence of early trade. Isn’t a long-standing explanation for the prominence and wealth of Bronze-Age Troy that its location had made it a trading center? Solomon, estimated to have ruled from 970 to 931 BC, enriched Israel and Judah through trade. The cedars of Lebanon were a trade good; why not raw iron? Why would historians and archaeologists assume no trade in iron blooms during the early Iron Age? Seems completely cockeyed.