Headline, Core PPI above Bloomberg consensus (1.4% vs. 0.5% m/m; 1.0% vs. 0.3% m/m).
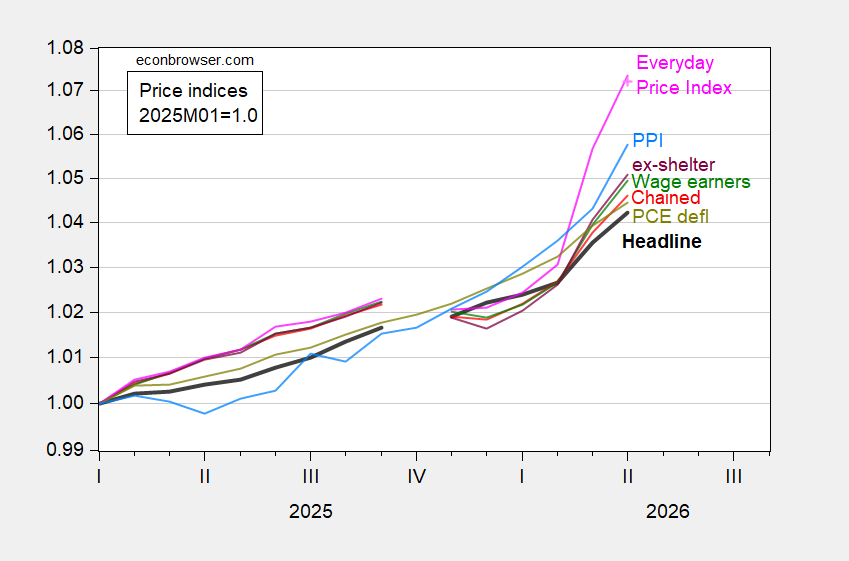
Figure 1: CPI-all urban (bold black), CPI wage earners and clerical (green), CPI ex-shelter (purple), CPI chained (red), PCE deflator (chartreuse), AIER Everday Price Index (pink), nowcasted AIER EPI (pink +), PPI (sky blue), all 2025M01=1.0, on log scale. Chained CPI is n.s.a. April PCE deflator is nowcasted as of 5/11. Source: BLS, BEA via FRED, AIER, Cleveland Fed, and author’s calculations.
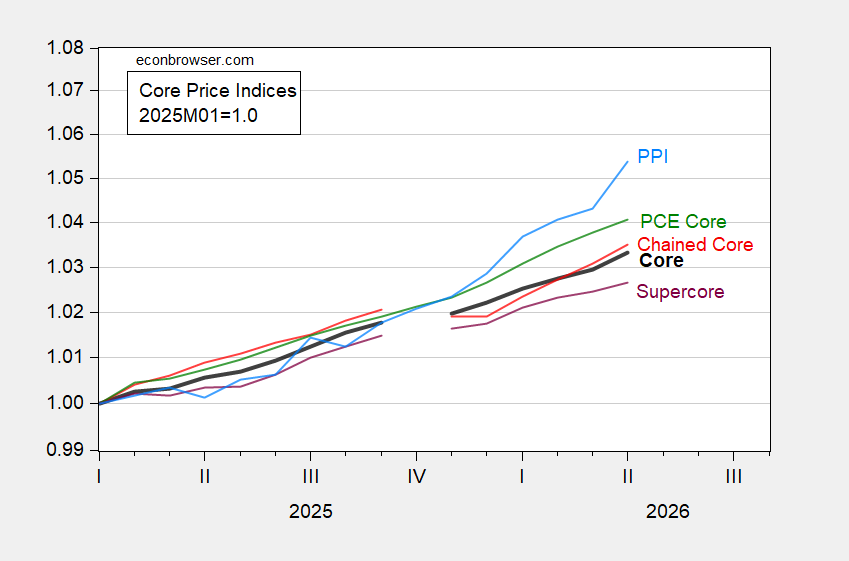
Figure 2: Core CPI-all urban (bold black), CPI chained core (red), CPI supercore (purple), PCE core deflator (green), core PPI (sky blue), all 2025M01=1.0, on log scale. Chained CPI is n.s.a. April PCE core is nowcasted as of 5/11. Source: BLS, BEA via FRED, BLS, Cleveland Fed, and author’s calculations.
Are there implications of PPI for CPI? A simple VAR using a Cholesky decomposition (PPI ordered first) indicates that there is a significant impact, at least over the 2022-2026M04 period:
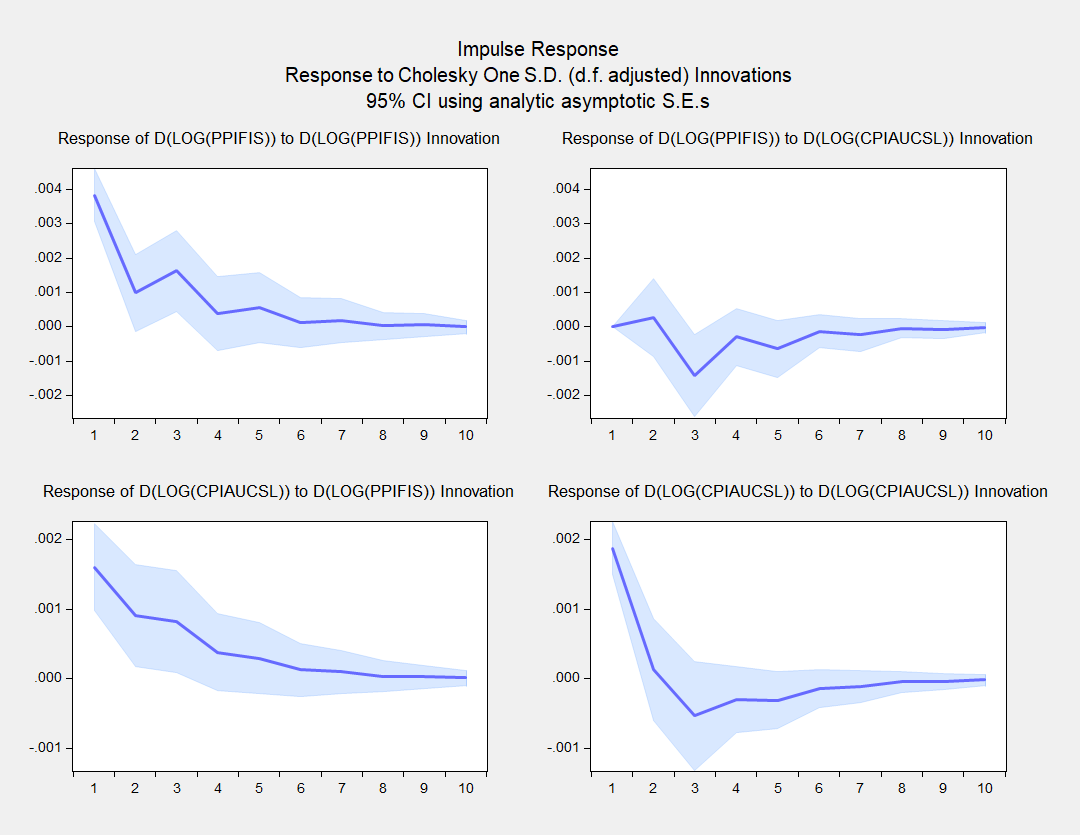
Figure 3: VAR Impulse Response Function with first log differences of PPI and CPI, 2022M01-2026M04. Cholesky decomposition, PPI ordered first.
The bottom left hand side IRF is the most important graph for our purposes. Over this sample period, a shock to PPI leads to an increase in CPI.
It’s true that the older literature Clark (1995) provides a more skeptical view that (legacy) PPI’s provide additional systematic predictive power. However, Caporale et al. (2002) used a more formal multivariate approach to conclude that for G-7 economies, PPI’s do lead CPI’s. Williams, (Empirical Economics, 2024) notes:
we identify several weighted disaggregated [PPI] series that unidirectionally influence or “cause” consumer price inflation providing valuable information for forecasters and policymakers. … we ascertain that three specific disaggregated producer price indices alone account for approximately two-thirds of the variation in consumer price inflation forecasts [over the 2012-2021 period]
These three categories are WPU05 (fuels and related products and power), WPU10 (metals and metal products) and WPU12 (furniture and household durables). Clearly, WPU05 has jumped.
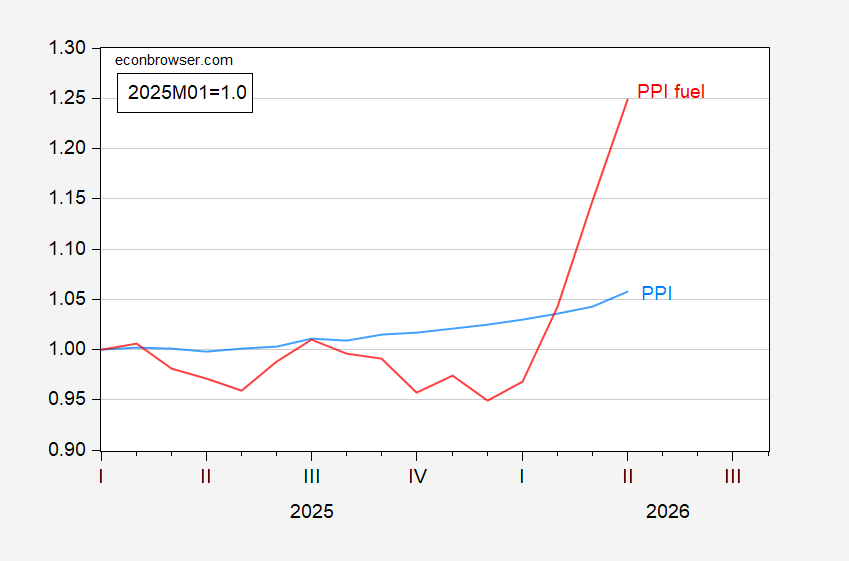
Figure 4: PPI (sky blue), PPI for fuels (red), both in 2025M01=1.0. Source: BLS and author’s calculations.
In a note today, Goldman Sachs concludes that the news regarding the PCE relevant items in the PPI did not necessitate a change in their tracking estimate for the PCE deflator, which is what the Fed follows most closely.
So far the price shock looks smaller than the 2022 Ukraine invasion shock, but it’s early and we can do a lot worse if the US administration is willing to go all-in on destroying supply chains in the Middle East and elsewhere.
Well, it’s official. Warsh is in and Miran is out. The vote was 54 to 45, on party lines (except for Fetterman), the first in history. For reference, Powell was confirmed 85 to 12 and 80 to 19 for his two terms.