As of the April 2026 CPI release:
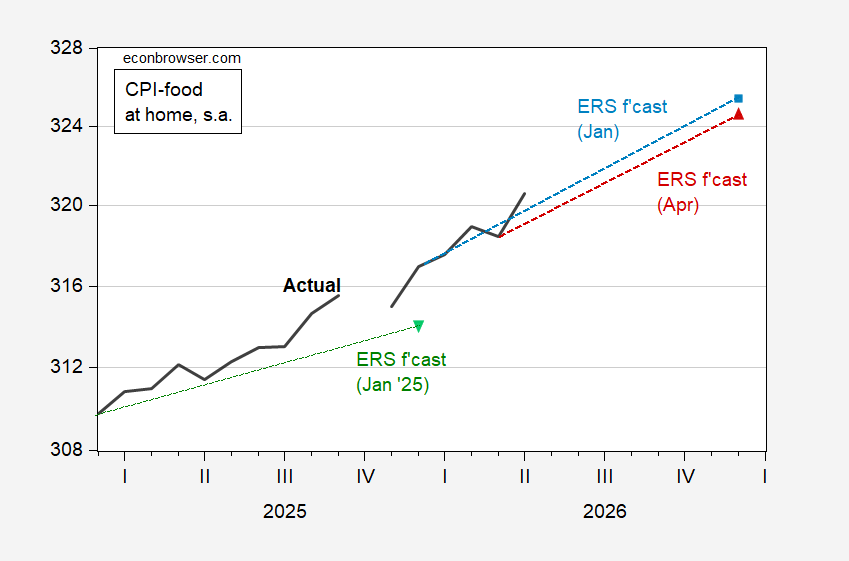
Figure 1: CPI – food at home (black), January 2025 ERS forecast (inverted green triangle), January 2026 forecast (light blue square), April 2026 forecast (red triangle), all on log scale. Source: BLS, ERS, and author’s calculations.
Note that 2025 groceries inflation outstripped the January 2025 forecast, with the price index ending up 0.9 ppts higher than originally forecasted.
Some individual commodities since January 2025.
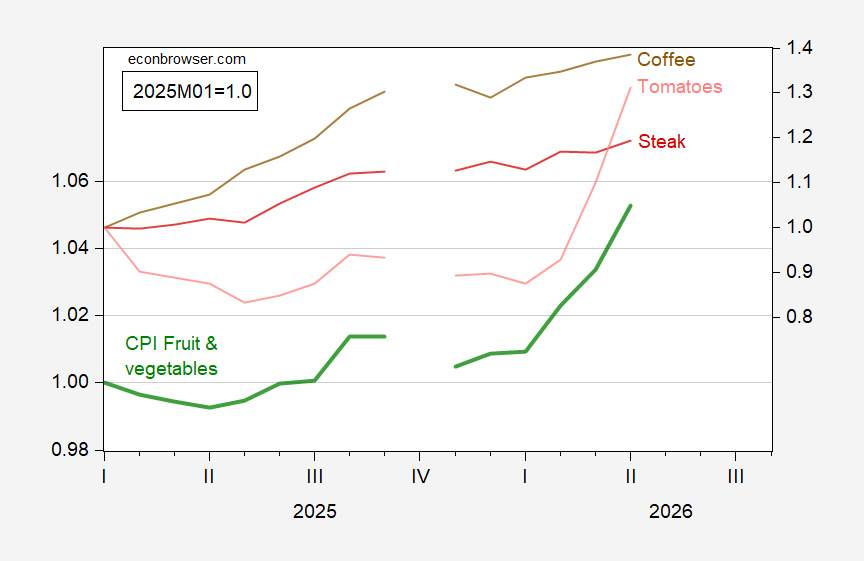
Figure 2: CPI – fruit and vegetables (green, left log scale), coffee (brown, right log scale), steak (red, right log scale), tomatoes (pink, log right scale), all 2025M01=1.0, on log scale). Source: BLS via FRED, and author’s calculations.
Anything with a limited shelf life is going to reflect higher transportation costs more immediately, and simply more, than other groceries. Brief shelf life means less flexibility in delivery, which means less ability to avoid costs.
Notice fruits and vegetables generally, tomatoes specifically, in Figure 2.
Oh, by the way, NPR reports that this is the Transportation Department’s truck safety inspection week. Typically, some trucks shut down for inspection week every year. Truckers expect more trucks off the road this week than in most years because DOT is now a rat for ICE.
Which is to say, if you notice supply disruptions over the next few days, they may be partly a short-term calendar problem, not a stupid war problem.
There’s a bit of chatter since the productivity report about a fresh decline in labor’s share of U.S. business income. Greg Ip, Talking Points Memo, and this guy, among others:
https://bsky.app/profile/carlquintanilla.bsky.social/post/3mlbusipcic2u
It’s all based not on an official U.S. data series, but rather the work of Michael D. Giandrea and Shawn A. Sprague back in 2017:
https://www.bls.gov/opub/ted/2017/labor-share-of-output-has-declined-since-1947.htm
They put together a handful of existing data series to get a more complete estimate of what labor receives. That estimate is not available, as far as I can tell, from the Labor Department, but is available from the Penn Tables via FRED, as “Share of Labour Compensation in GDP at Current National Prices for United States”:
https://fred.stlouisfed.org/series/LABSHPUSA156NRUG
FRED hasn’t updated since 2023 but in Q1, labor received 54.1% of the value of business output, a new low.
This is not, by the way, a phenomenon unique to the U.S. Fred has similar series for other countries. Seems like everybody had been doing it, but Germany and Japan have recently turned back toward better treatment of labor:
https://fredblog.stlouisfed.org/2019/08/capitals-gain-is-lately-labours-loss/