The latest release shifted the peak in real personal income excluding current transfers — a key indicator followed by the NBER’s Business Cycle Dating Committee — from January 2026 to September 2025, and changed the q/q annualized growth rate through March from -0.7% to -1.3%.
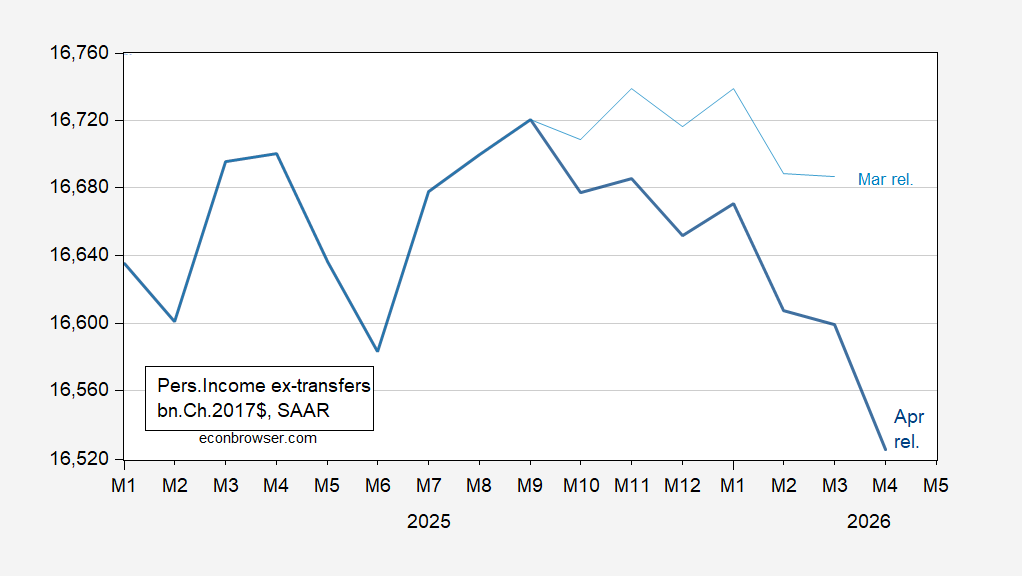
Figure 1: Personal income excluding current transfers, March release (light blue), April release (bold dark blue), both bn.Ch2017$ SAAR. Source: BEA via FRED.
April income is down 1.2% below the September peak.
Most of the revision is attributable to updated estimates of personal income.
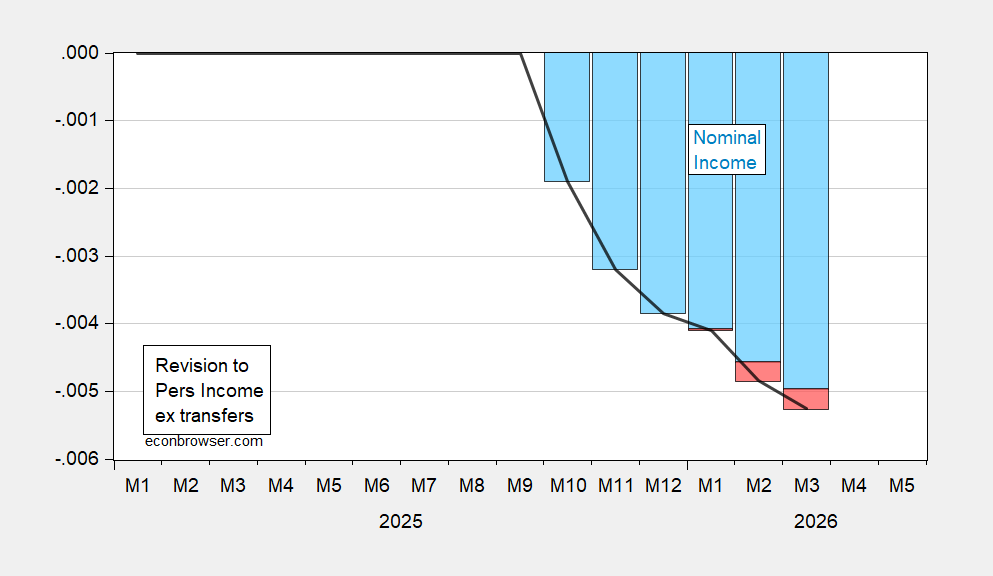
Figure 2: Revision to real personal income ex-transfers in log difference (black line), attributable to nominal income revision (light blue bar), to PCE price deflator revision (red bar). Source: BEA, and author’s calculations.
A similar pattern holds for disposable income, where the revision is largely attributable to the revision in nominal values. However, the most recent peak could be either January 2026 or April 2025 (The March release would have put the peak unambiguously at January 2026). April disposable income is 1.1% below either peak.
To the extent that we want to measure market derived income from labor and capital in order to assess the business cycle state, the series depicted in Figure 1 seems more relevant. This series, in the context of other macro indicators, is shown in Figure 1 of this post.
It’s of course possible that personal income will rebound, hence rendering these peaks as “local maxima”. If, as is widely believed, AI will sustain economic growth as measured by production, it’s hard to see how personal income will continue to decline (even if the growth is concentrated in a few sectors).
Just to chip in, here are real disposable personal income per capita and the personal saving rate:
https://fred.stlouisfed.org/graph/?g=1WIyB
Real per capita disposable income peaked in April of 2025 (Liberation Day!!!) and the saving rate is at its lowest point since June 2022.
And Hassett says consumer sentiment is poorly because Democrats are meanies. Here’s Krugman on who’s really out of touch:
https://paulkrugman.substack.com/p/whos-deranged-exactly
Three guesses.