Real consumption upside surprise, but large personal income ex-transfers downside surprise, plus downward revisions (along with Q1 GDP downward revision).
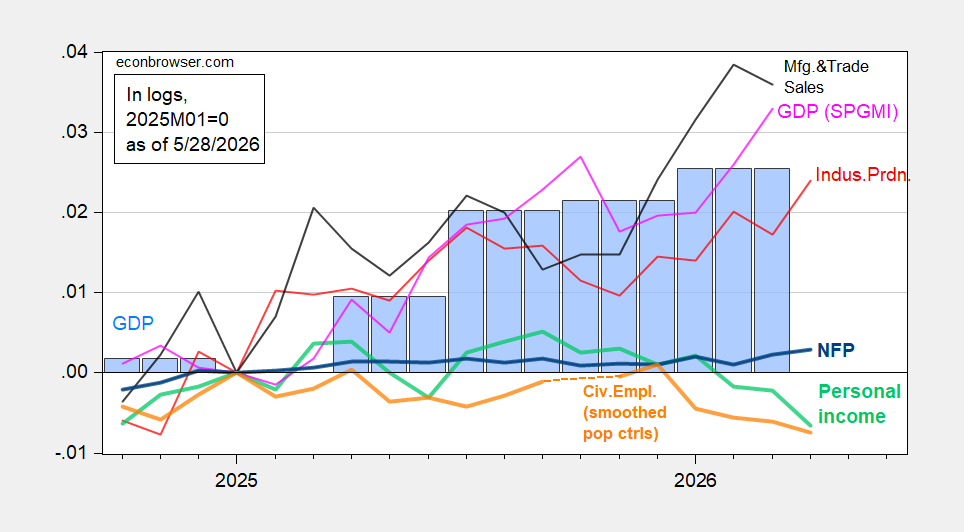
Figure 1: NFP employment (bold blue), civilian employment with smoothed population controls (bold orange), industrial production (red), personal income excluding current transfers in Ch.2017$ (bold light green), manufacturing and trade sales in Ch.2017$ (black), and monthly GDP in Ch.2017$ (pink), GDP (blue bars), all log normalized to 2025M01=0. Source: BLS via FRED, BLS, Federal Reserve, BEA 2026Q1 2nd release, S&P Global Market Insights (nee Macroeconomic Advisers, IHS Markit) (5/7/2026 release), and author’s calculations.
Note that personal income (which tracks closely personal income ex-transfers over the last 6 months) not only surprised on the downside (-0.4% vs. 0.0% m/m), but was revised downward noticeably. Hence, personal income ex-transfers in the current vintage of data appears to have peaked in September 2025 (as opposed to January 2026 in the previous vintage). If this contour for income proves durable over subsequent releases, then this will be significant insofar as personal income ex-transfers is a key variables followed by the NBER’s Business Cycle Dating Committee (BCDC).
Employment (nonfarm payroll employment from the establishment survey, and civilian employment from the household survey) both factor into the BCDC’s determination of turning points, with (historically) greater weight on the former, given its lower volatility and sampling error. However, with recent developments in the labor market (reduced immigration and hence lower breakeven growth rate of employment, and measurement issues), it’s unclear how the BCDC would view the recent slowing (as in NFP) or downturn (as in the household series). The interpretation of the household series (FRED mnemonic CE16OV) is further complicated by the fact that the January 2026 onward data incorporate new population controls; the change in civilian employment from December 2025 to January 2026 needs to be taken with extra caution.
In order to see how the labor market has trended, I include private NFP from ADP in Figure 2; this series confirms the slow growth in NFP. The civilian employment series adjusted to NFP concept mirrors the overall trend in civilian employment — which is a peak in late 2025.
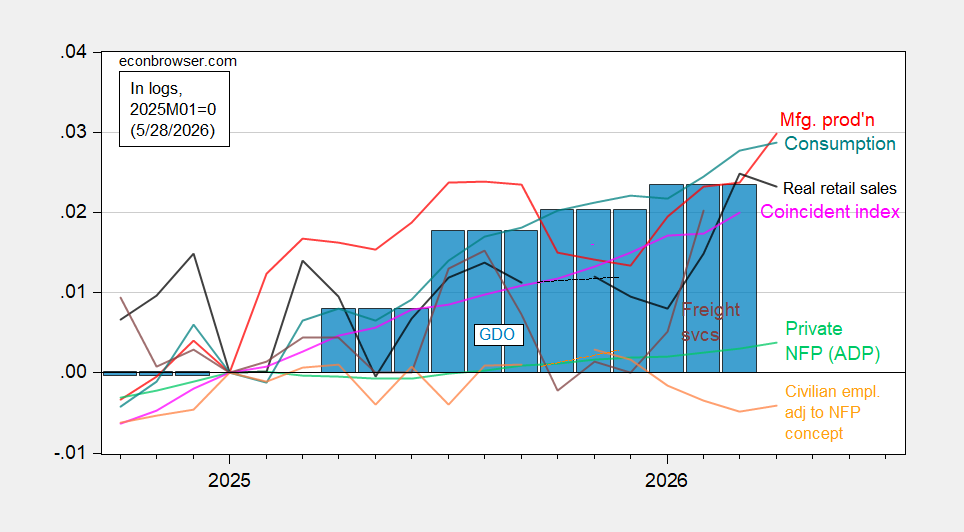
Figure 2: Civilian employment adjusted to NFP concept smoothed population controls (bold orange), manufacturing production (red), ADP private nonfarm payroll employment (light green), real retail sales, CPI deflated (black), freight services indexes (brown), and coincident index in Ch.2017$ (pink), GDO (blue bars), all log normalized to 2025M01=0. Source: BLS, ADP,via FRED, Philadelphia Fed, Bureau of Transportation Statistics, Federal Reserve via FRED, BEA 2026Q1 2nd release, and author’s calculations.
Interestingly, consumption shows continued albeit slowing growth. Continued consumption growth in the face of lackluster income growth seems counterintuitive; however, it makes sense if household wealth continued its upward trend (as speculated in yesterday’s post). The S&P 500 has rebounded in April, and further, into May.
It bears repeating that the monthly data reported for April are all preliminary, and revised values incorporating additional information will be published in a month. April personal income, consumption, employment may very well force some change to the overall impression provided by these two graphs.
As of today, GDP (GDO) [GDP+} grew by 1.6% (1.3%) [1.57%] in Q1 (SAAR), while final sales to private domestic purchasers (“core GDP”) grew by 2.4%. GDPNow for Q2 is 3.8% (down 0.5 ppts from previous release, due to consumption and inventory investment downgrade).
Real personal income less government transfers peaked last September and has declined in five of the seven months since. Aggregate nonsupervisory payrolls deflated by the PCE chain type index peaked last December:
https://fred.stlouisfed.org/graph/fredgraph.png?g=1WGYy&height=490
Why is this significant? Because not only is the former down -1% YoY, but the latter is only up 0.7%:
https://fred.stlouisfed.org/graph/fredgraph.png?g=1WGYb&height=490
In the past 60 years, YoY values of these indicators have only been this low or lower during recessions.
This, together with nonfarm payrolls, suggests that a consumer recession started late last year. This contrasts with producer side metrics like industrial production, durable goods orders, real manufacturing and trade sales, corporate profits, and the stock market, all of which are either booming or at least positive. Which in turn suggests that it is AI data center related spending which is keeping the economy as a whole out of recession.