Discussion with Justin Ho on MarketPlace yesterday. Disposable income (after tax, after transfers) is useful for assessing the state of the consumer finances, while personal income ex-current transfers — followed by the NBER’s BCDC — is a better reflection of income coming from economic activity.
“If you’re trying to get at the underlying state of the private sector, personal income excluding the current transfers is more useful.”
Here’s a graph showing the contrasting profiles for disposable income vs. income ex-transfers.
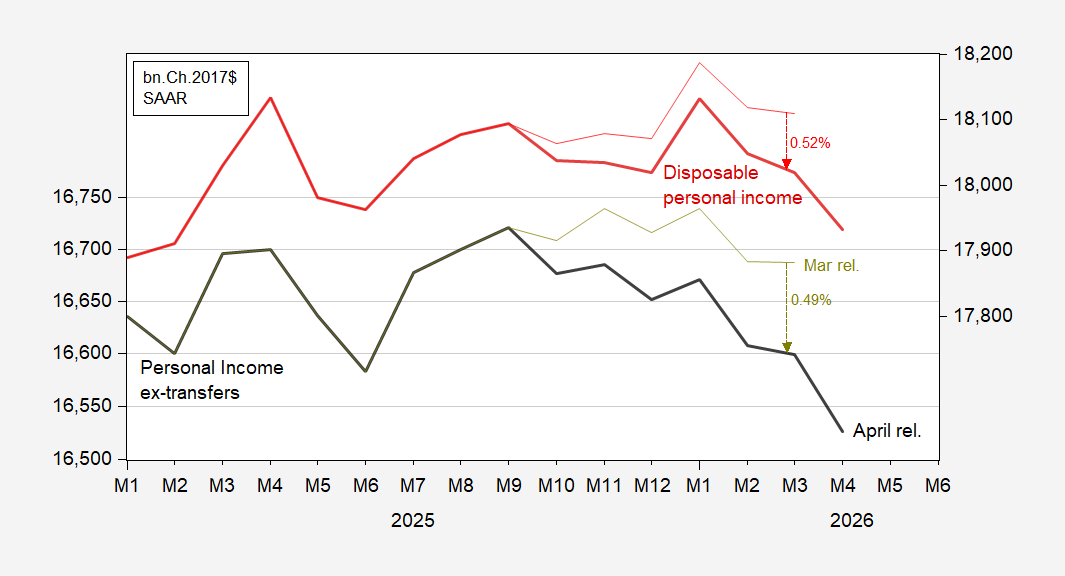
Figure 1: Personal income excluding current transfers, April release (bold black, left log scale), March release (chartreuse, left log scale), disposable personal income, April release (bold dark red, right log scale), March release (light red, right log scale), all in bn.Ch.2017$. Source: BEA.
Notice the substantial revision in the level of income (about half a percentage point) followed by the downward move in April (prel.) means the trajectory of income measured either way is now substantially more negative. This observation also illustrates why NBER BCDC waits a substantial period of time to make assessments regarding business cycle dates. (As I’ve noted elsewhere, very large revisions can occur for GDP, especially around what are subsequently identified as turning points).
Notice that most of the downward revision is attributed to updated information regarding wages and salaries showing up in the latest release of QCEW, as well as recent information regarding recent months’ worth of CES data (and not to price deflator revisions).
Trends in both personal income series highlight the growing disjuncture between output measures on the one hand, and personal income (and employment) series on the other.
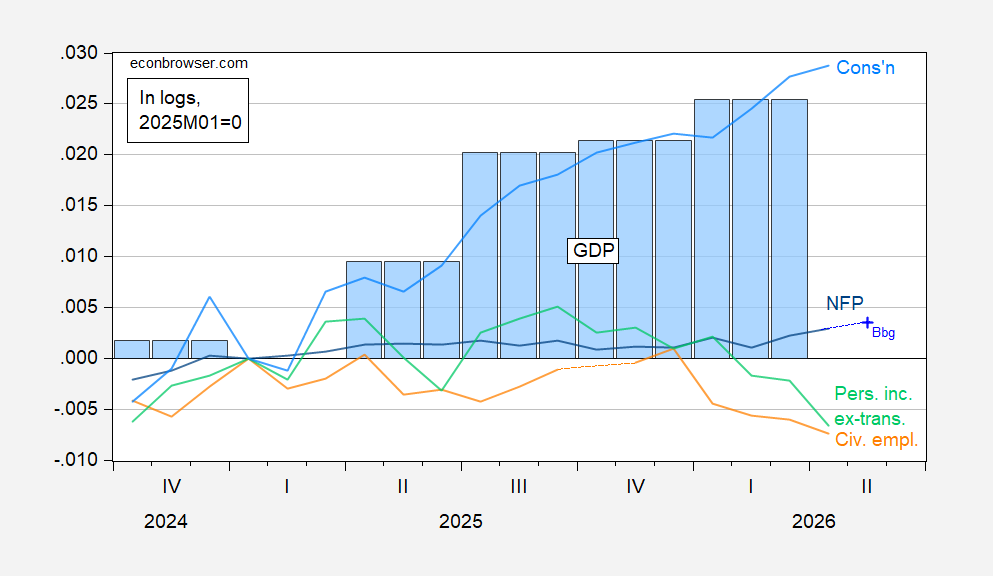
Figure 2: NFP employment (blue), civilian employment with smoothed population controls (bold orange), personal income excluding current transfers (light green), consumption (light blue), GDP (blue bars), all log normalized to 2025M01=0. Source: BLS via FRED, BLS, BEA 2026Q1 2nd release, and author’s calculations.