Nonfarm payroll employment upside surprise from CES. CPS indicates something less positive, as does ADP, trendwise.
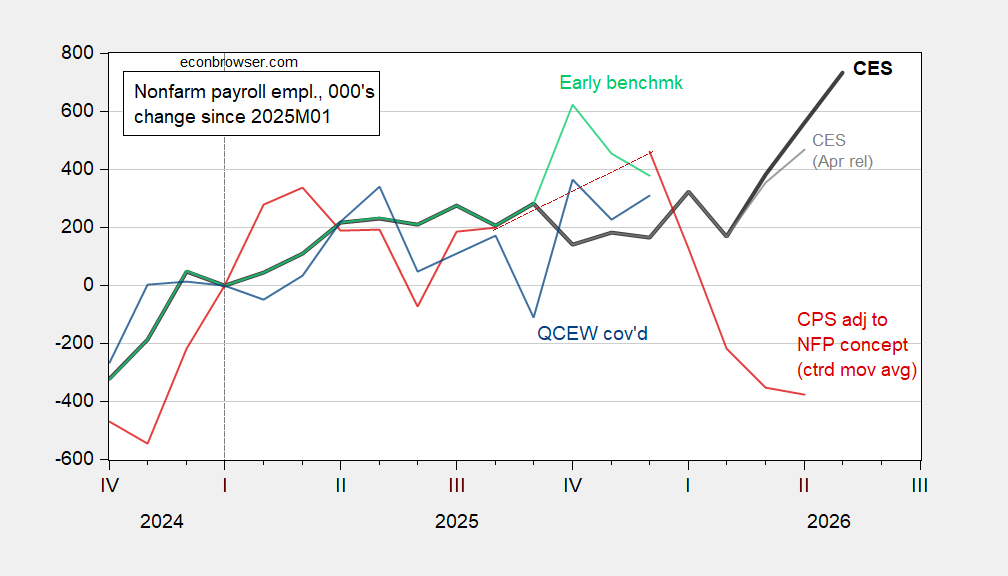
Figure 1: Change in nonfarm payroll employment according to CES May release (bold black). April release (gray), CPS series adjusted to NFP concept, 3 month centered moving average (red), early benchmark (light greenn), and QCEW covered employment (blue), all in 000’s, s.a. QCEW series adjusted by author using X-13 over 2022-2026 period. Source: BLS, Philadelphia Fed, and author’s calculations.
April NFP was noticeably raised, adding to the upward move in NFP. However, the gap between the CES and CPS series continue to diverge.
The May increase of 72K is large, but should be taken in context, as the Mean Absolute Revision going from 1st to 3rd release in 2025 was 53K.
Another check on the BLS results is by reference to the ADP release. Here additions to total job counts have lagged when measured by ADP.
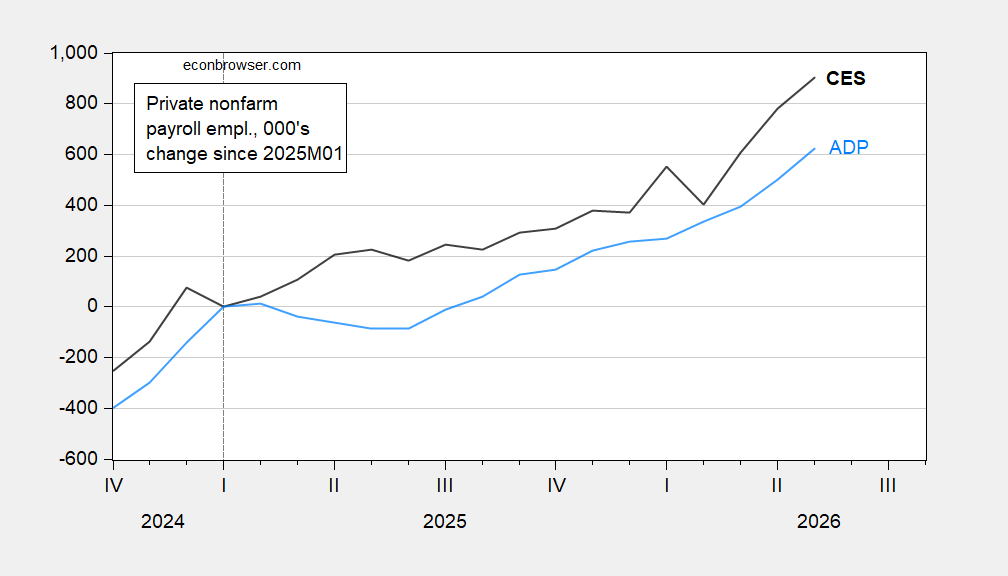
Figure 2: Private nonfarm payroll employment (CES) (black), ADP (sky blue), in 000’s, s.a. Source: BLS, ADP via FRED.
Finally, the employment release suggest rapid erosion of real wages.
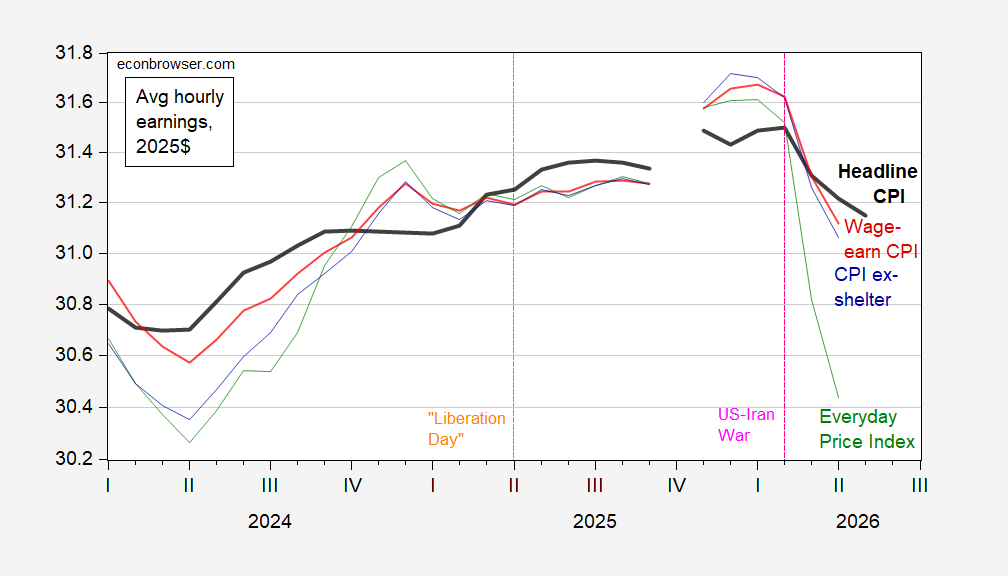
Figure 3: Average hourly earnings deflated by headline CPI (bold black), by wage-earners and clerical workers CPI (red), by CPI-ex shelter (blue), by Everyday Price Index (green), all in 2025$. Headline CPI for May nowcasted by Cleveland Fed. Source BLS, AIER, Cleveland Fed, and author’s calculations.
Average real wages measured in a variety of ways have decreased sharply since February. It’s 1.1% using nowcasted CPI. Through April, it’s a 1.6% using the wage earners & clerical workers CPI.